| | | | | | | GENERAL INFORMATION FOR 2024 |
|
|
| | | | | | | | | | | | | | | | | | | | | | | | | | | | | | | | | | | 18 477 Millions current US$ |
| | | | | | | | | | | | | | | | | | | | | | | | | | | | | | |
|
|
|
| | | | | | | | | | | | | | | INTERNATIONAL MERCHANDISE TRADE |
| | | | |
|
| | | | | | | | | | | | Merchandise exports growth rate in 2024 |
|
|
| | | | | | | | | | | | | | | | | | | | | | | | | | | | | | | | | Merchandise trade balance |
| | | | |
| |
|
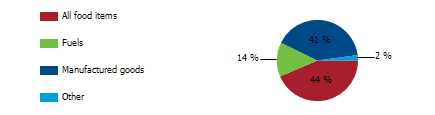
| | | Export structure by product group in 2024 |
|
| | | | | | | | | | | (exports, millions of US$) |
| | | | |
|
| | | | | | | INTERNATIONAL TRADE IN SERVICES |
| | | | |
|
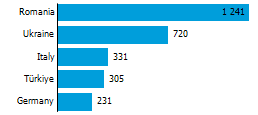
| | | | | | | | | | | Services exports by main category² |
|
|
|
| | | | | | | | | | | | | | | | | | | | | Gross domestic product growth rate in 2024 |
|
|
| | | | | | | | | | | | | | | (millions of US$ unless otherwise specified) |
| | | | | | | | | | | | GDP per capita, current US$ |
| | | | | | Real GDP growth, y-on-y, % |
| | | | | | Current account balance, % of GDP |
| | | | | | | | | | |
| |
|
| | | | | | | | GDP by expenditure in 2023 |
|
|
|
|
|
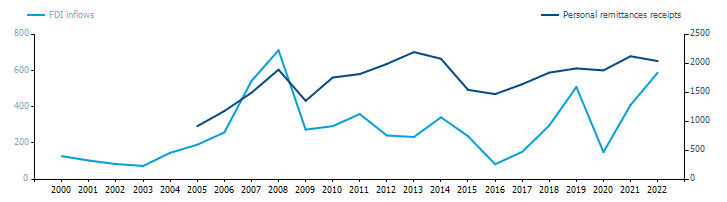
| | | | | | | | | | FDI AND EXTERNAL FINANCIAL RESOURCES |
| | | | |
|
| | | | | | | | | | | | | | FDI outflows as % of GDP in 2024 |
|
|
| | | | | | | | | | | | | | | (millions of US$ unless otherwise specified) |
| | | | | | | | | | | | | | | | | | Personal remittances, % of GDP |
| | | | |
| |
|
| | | | | | | | | | | | | | |
|
| | | | | | | TRADE IN GOODS AND SERVICES |
| | | | |
|
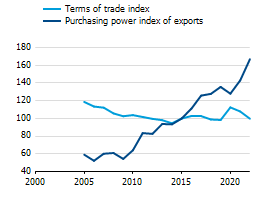
| | | | | | Trade balance indicators² |
|
| | | | | (sum of imports and exports as % of GDP) |
|
|
|
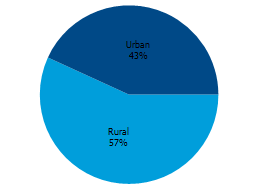
| | | | | | | | | | | Population by living area in 2024 |
| | | |
|
|
|
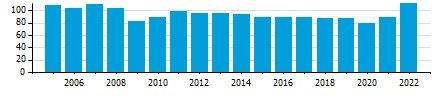
| | | | | | | | | | | | | | | | | | | Share of the total world merchant fleet in 2024 |
|
|
| | | | | | | Maritime transport indicators |
| | | | | | | | | | | | | | Merchant fleet, national flag (thousands of DWT) |
| | | | | | Container port throughput (TEU) |
| | | | |
| |
|
| | | | | | | Information economy indicators |
| | | | | | | | | | | | | | Share of ICT goods, % of total exports |
| | | | | | Share of ICT goods, % of total imports |
| | | | | | Share of workforce involved in the ICT sector |
| | | | |
| |
|
| | | |
|
|
|
| | | | | | | | | | | | | | | | | Notes: | | 1 | Land area refers to the total area of a country excluding area under inland water bodies. It differs from the country area, that includes area under inland water bodies, but excludes offshore territorial waters. | | 2 | Statistics presented correspond to the 6th edition of the IMF Balance of Payments and International Investment Position Manual (BPM6, 2009). | | u | Estimated. Data refers to 2020. |
| | | | | | | | | Symbols for missing values: | | 0 | Zero means that the amount is nil or negligible | | .. | No value reported or collected | | _ | Not applicable | | ... | Not available, including no quotation | | # | Non-relevant calculation | | - | Not publishable | | *** | Negative accumulation of flows; Value included in regional and global totals |
| | | | | Abbreviations & acronyms: |
| | | | | | | | Foreign direct investment |
| | | | | | | | Information and communication technology |
| | | | Twenty foot equivalent unit |
| | | | | | | | | Disclaimer: The designations employed and the presentation of the material on UNCTADstat do not imply the expression of any opinion whatsoever on the part of the secretariat of the United Nations concerning the legal status of any country, territory, city or area, or of its authorities, or concerning the delimitation of its frontiers or boundaries.
Where the designations "economy" or "country or area" appear in texts or tables, they cover regions, countries, territories, cities or areas.
UNCTAD strives for the highest level of accuracy and is committed to promptly correcting any errors on its part. It does not guarantee or make any express or implied representations regarding the accuracy, reliability, correctness, fitness for use for a particular purpose, or otherwise, whatsoever, of any of the tables in UNCTADstat. |
| | | | | Generation date: 02 December 2025 |
|
|
|
|

 PDF
PDF Share
Share


")