
Trade in biodiversity-based products
Background
Biodiversity is at the centre of many economic activities and directly supports the livelihoods of nearly half the world’s population, with many of the world’s most vulnerable being directly dependent on it to satisfy their subsistence needs.1 Biodiversity-based resources are also widely traded globally with approximately half of the world’s GDP dependant on nature to some extent.2 The Trade and Biodiversity (TraBio) database, which contains information on global trade flows of biodiversity-based products, provides access for all to consistent and complete data on imports and exports of biodiversity-based products and other relevant indicators. It thus aims to contribute to establish a harmonized and internationally accepted statistical framework for biodiversity-related trade.
The Trade and Biodiversity (TraBio) statistical tool (TraBio product classification and database and this visualization tool) was developed under the “Global BioTrade Programme: Linking trade, biodiversity and sustainable development” funded by the Swiss State Secretariat for Economic Affairs SECO.
Want to learn how to use TraBio’s statistical tool, including its database, please visit our self-paced TraBio training in English, French and Spanish.
Trade in biodiversity-based products
The interactive maps and charts presented below have been designed to help explore biodiversity-based trade data over time and space, providing a critical tool for revealing geographical patterns. The data presented covers 185+ economies from 2010 until the most recent year for which data is available.
World map – Trade flows of biodiversity-based products, 2024
This map presents the bilateral import and export flows of biodiversity-based product aggregates at the Group level of the TraBio product classification hierarchy for the selected economies (can select up to 15). By selecting imports or exports the map shows trade flows to/from the top 3 partners for the selected economies and products.
Notes: Top 5 countries (imports + exports of the selected product aggregate) are shown in the default selection.
World map – Trends in biodiversity-based trade
This map aims to give a visual representation of the main products traded by geographical location, as well as their value between 2010 and the latest year for which data is available. This map offers an additional level of detail in the selection of products with respect to the previous one, with the possibility of selecting aggregates at the Group, Subgroup, and Category level of the TraBio product classification hierarchy.
The bar charts below disaggregate the selected product aggregate into its sub-aggregates with an increased level of detail for the selected countries (up to 15), as colour coded by the legend.
When the dial is set to Main export or Main import, the countries’ colour indicates its most exported/imported sub-aggregate, whereas if the dial is switched to Exports value or Imports value their shading varies according of the trade value of the selected product aggregate.
Notes: Top 5 countries (imports + exports of the selected product aggregate) are shown in the default selection.
World map – Trends in biodiversity-based indicators
This map allows to visualise several trade indicators by selecting the desired indicator from the dial on the left: trade balance, growth in exports and imports of biotrade, biotrade as a share of total trade, and biotrade as a share of GDP. The map will show each country with a different shade based on the scale on the left for the selected year. A time series will be shown below the map for the selected indicator and countries over the past 10 years.
Notes: Top 5 countries (imports + exports of total BioTrade) are shown in the default selection.
BioTrade or biotrade?
While the terms “BioTrade” and “biotrade” could appear to be interchangeable, the capitalization of “B” and “T” in BioTrade reflects a fundamental difference. The term “biotrade” is sometimes used to describe the trade in biological resources for use as ingredients or inputs for food, cosmetic or industrial products, independently from whether these have been produced sustainably or not. “BioTrade”-related activities on the other hand, are characterized by respect for environmental, economic and social sustainability criteria – in particular the BioTrade Principles and Criteria (P&C). The following map shows the countries in which BioTrade partners are implementing the BioTrade P&C and related schemes in 2024.
Trade flows and indicators showcased in the database cover all trade in biological resources, even if goods are produced without proper sustainability considerations (in short: biotrade), rather than BioTrade or even certified sustainable trade in biodiversity-based goods more generally. In fact, great efforts would be required to enable systematic data collection, particularly on trade, for certified sustainable goods that is comprehensive as well as comparable at a regional and/or global level. This is due to numerous reasons, including issues such as lack of harmonized trade-data on certified goods in general, the proliferation of voluntary standards as well as standard-setting organizations across the globe, or the confidential and sensitive nature of certain types of data.
Revealing biodiversity’s potential in addressing global threats
Despite these constraints, the TraBio database - jointly with the product classification and visualization tool which comprise the TraBio statistical tool - makes an important contribution to highlighting the economic importance of biodiversity-based trade, as well as biodiversity’s potential predominant role in addressing several global threats. It draws on lessons learned from the BioTrade Initiative and its partners’ decades long experience in the promotion of sustainable biodiversity-based trade through technical support to developing countries. TraBio provides information to improve the understanding of the significance of trade of biodiversity-based products. The information provided is also relevant to report and track progress on biodiversity-relevant goals and targets, such as the Sustainable Development Goals (SDGs) and the Kunming-Montreal Global Biodiversity Framework.
Trade and biodiversity statistical data and its components
The TraBio database contains data on bilateral and multilateral trade flows of 1,814 biodiversity-based products dating back to 2010. Biodiversity-based products are understood as all products having a biological origin, including plant and animal species found on land, water, and air,4 which meet at least one of the following criteria:
- they are intrinsically and integrally based on biological resources themselves at a non- or low-processed stage (e.g., whole pineapples or ground coffee);
- when used as inputs, they are processed products that solely or principally use biological resources-based ingredients (e.g. cotton shirts, wooden furniture, or chocolate bars; and
- when they are derivatives, they are derived mainly from biological resource-based products (e.g. glycerol from natural oils and fats).
In this understanding, goods produced or derived from the extraction of minerals, ores, or metals, such as sands, oil and gas, are not considered biodiversity-based products.5
Harmonized Description and Coding System (HS)
The data in the database is organized based on the Harmonized Description and Coding System (HS)6 nomenclature, a multipurpose international product nomenclature developed by the World Customs Organization (WCO).
It contributes to the harmonization of customs and trade procedures and has been selected as the goods classification method for the TraBio database because it does not only provide the greatest level of detail in product specification, but it is also a universally accepted economic language and code for goods, widely used across a wide range of applications, from customs procedures to academic research and reporting.
The TraBio product classification
Despite the great level of detail provided by the HS nomenclature, its classification was established with the objective of facilitating and standardizing the collection of statistics related to trade in general, rather than for biodiversity specifically. The TraBio product classification attempts to overcome this limitation of the HS: It is built on the availability and detail of the HS’s structural unit, the subheading,7 but categorizes the subheadings according to their use, composition, or considering their possible contribution to biodiversity-related political processes, such as in the case of the natural ingredients group and the medicinal plants subgroup for the post-2020 global biodiversity framework.
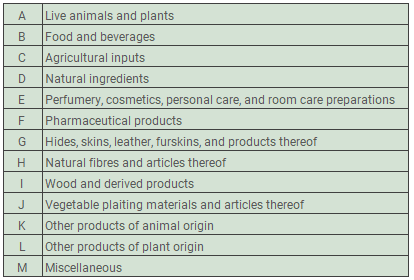
The TraBio product classification consists of 13 groups (table 1) divided into 86 subgroups. These are then further subdivided into 230 categories and 79 subcategories. HS subheadings are normally found at the category and subcategory levels, but in some cases can already appear in specific subgroups.
Biodiversity-based indicators
In addition to data on imports and exports, the database also contains the following indicators:
- Trade balance for biodiversity-based products – An economy’s trade balance is the difference between the value of its exports and its imports for a given period, usually a year.
- Trade of biodiversity-based products as a share of total trade – This measure indicates the percentage biodiversity-based products represent of total exports and imports for a country or group of countries.
- The weight of biodiversity-based trade in the economy – This indicator is a measure of the trade value of biodiversity-based products as a share of GDP.
- Growth rates of trade in biodiversity-based products – Indicates the rate of growth of trade in biodiversity-based products between one time period and the next.
- Market concentration index – The market concentration index measures the degree of concentration of exports and imports of a product around few markets, or whether it is traded more homogeneously by a larger number of countries.
- Product concentration index – The product concentration index is a measure of the degree of concentration of trade, meaning whether the composition of biodiversity-related exports and imports is concentrated around few or many products.
- Structural change index – The structural change index describes how the distribution of imports and exports in a specific product among markets (economies) has changed over time.
- Revealed Comparative Advantage (RCA) index – The RCA index shows differences in productivity between economies extrapolated from their trade data, thus “revealing” where comparative advantages that govern global trade patterns lie.
A more comprehensive description of the methodology, assumptions and considerations linked to the development of the TraBio database is available in the upcoming report Trade and Biodiversity Statistics: Methodological approach.
Data sources and approach
The trade flows and indicators contained in the TraBio database are all calculated from trade data from UNCTAD’s statistics platform UNCTADstat, an internationally comparable and rigorous data source.
The methodology to adapt these well-known trade indicators to the biodiversity realm has been set out by the BioTrade Initiative in collaboration with UNCTAD’s Statistics service as part of the creation of its TraBio statistical tool under the Global BioTrade Programme: Linking trade, biodiversity and sustainable development, supported by the Swiss State Secretariat for Economic Affairs SECO.
This methodology draws upon a review of existing literature, reports and data sources, customs classification of goods based on the Harmonized Commodity Coding and Description System, e-surveys and discussions with relevant stakeholders, including national, regional and international partners of the BioTrade Initiative and organizations implementing the BioTrade Principles and Criteria.
In addition, this methodology was enriched by lessons learned and experiences from a pilot exercise conducted by UNCTAD’s BioTrade Initiative and Statistics service for a selected number of countries and products from September 2019 to February 2020. Finally, it also benefited from the feedback provided by participants to two webinars in English and Spanish on trade and biodiversity statistics conducted in June 2020.
Relevant biotrade publications
 BioTrade Principles and Criteria for terrestrial, marine and other aquatic biodiversity-based products and services (2020)
Notes
- Convention on Biological Diversity (CBD), Biodiversity and the Sustainable Development Goals, https://www.cbd.int/cop/cop-14/media/briefs/en/cop14-press-brief-sdgs.pdf
- World Economic Forum (WEF), 2020, Nature Risk Rising: Why the Crisis Engulfing Nature Matters for Business and the Economy, New Nature Economy series, http://www3.weforum.org/docs/WEF_New_Nature_Economy_Report_2020.pdf
- The structure, rationale and methodology behind the TraBio product classification is outlined in UNCTAD, 2022, The Trade and Biodiversity (TraBio) classification: Measuring trade in products with a biological origin.
- UNCTAD, SDG Pulse 2020 – UNCTAD takes the pulse of the SDGs, https://sdgpulse.unctad.org/wp-content/uploads/Unctad_SdgPulse_2020.pdf
- UNCTAD, BioTrade Principles and Criteria for terrestrial, marine and other aquatic biodiversity-based products and services, https://unctad.org/system/files/official-document/ditcted2020d2_en.pdf
- WCO, Harmonized System Database, http://www.wcoomd.org/en/topics/nomenclature/instrument-and-tools/tools-to-assist-with-the-classification-in-the-hs/hs-online.aspx
- In the HS nomenclature, the subheading is a 6-digit code describing each product or group of products in the greatest level of detail.