Data Centre Help
Main page
Tables are organized by statistical topic to make them easier to find. You can click on a topic to view its content and subtopics if any.
Each table has a title identifying its subject and periodicity (annual, quarterly, monthly). More information (sources, methodological notes and a detailed description) is available in the table metadata by clicking on the small icon ‘i’ to the right of the title.
To browse a table, just click on its title.
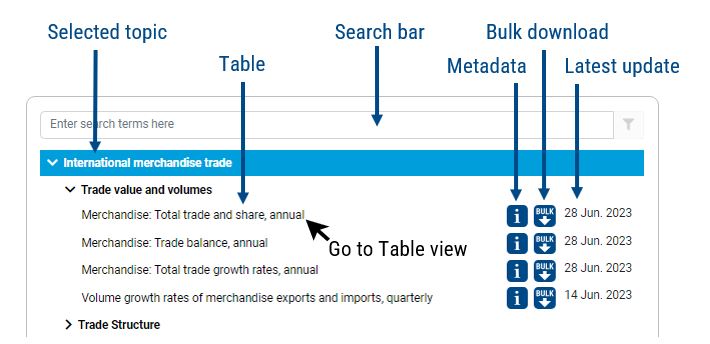
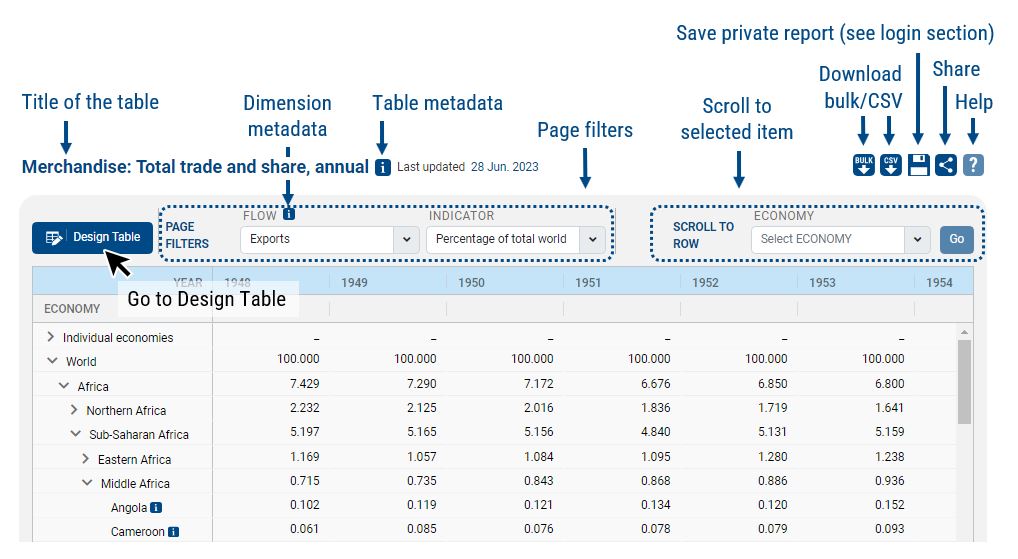
Table view
In the table view you can browse and filter the data you are interested in. To adjust the layout, just click on ‘Design Table’.
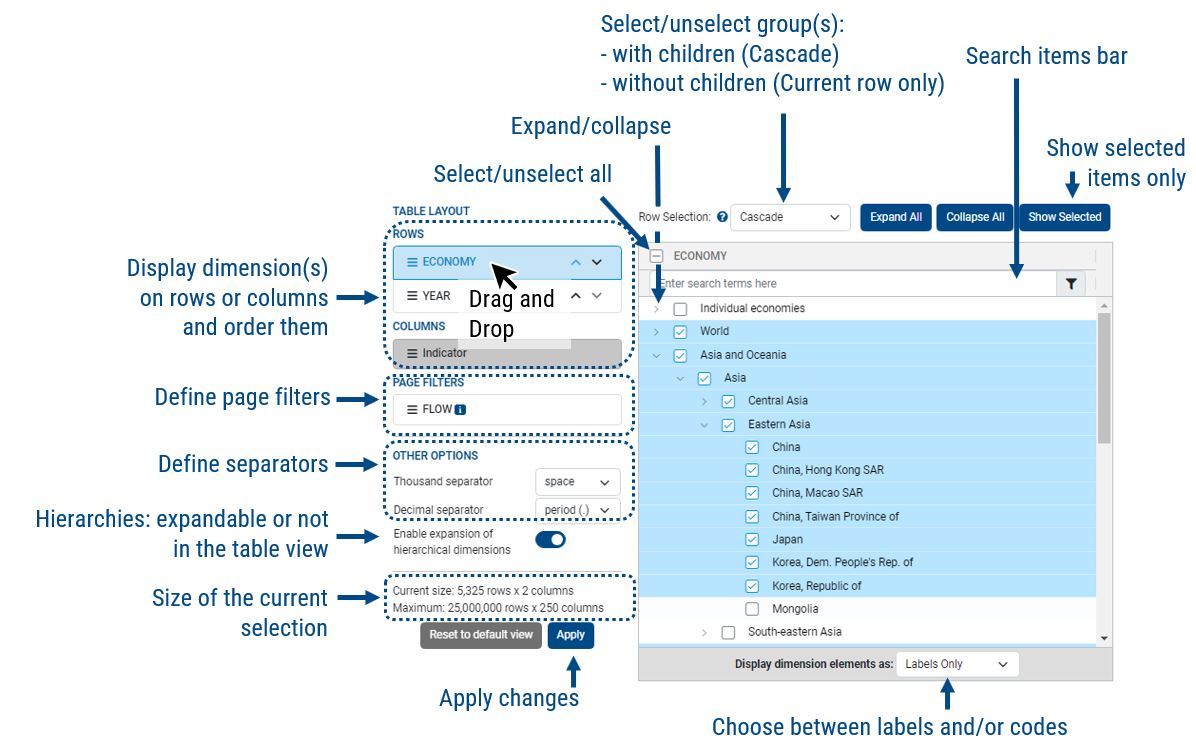
Design table
Here you can rearrange the table by moving dimensions with Drag and Drops and filtering your data. Don’t forget to press the ‘Apply’ button to save your changes and update the table view.
Login
If you wish to have the option of saving your private reports, you must first log into our Data Centre. To do so, click ‘Login’ at the top right of the page (please make sure popups are enabled on your browser).
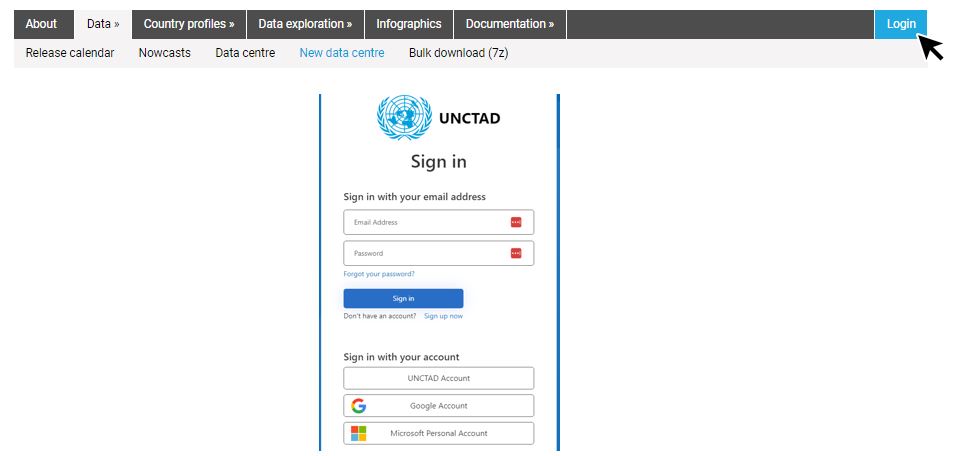
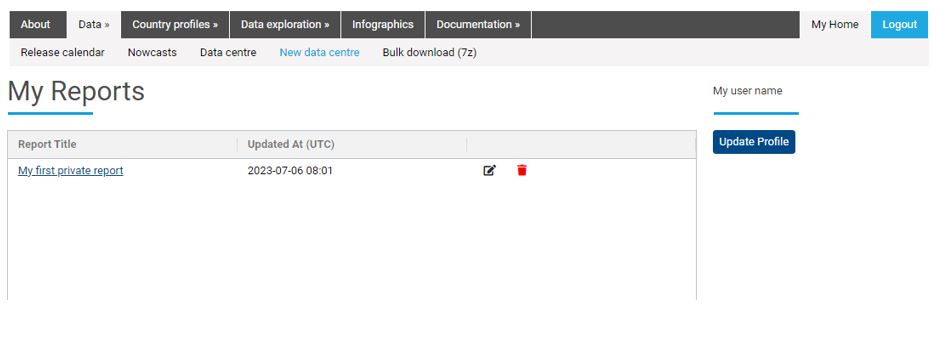
You can use an UNCTAD account, a Google account or a Microsoft Personnal Account. You can also create an UNCTADstat account by clicking ‘Sign up now’. Once logged in, you can rearrange a table and save it as a private report accessible under ‘My home’ (next to the ‘Login’ button).
Private reports are automatically synchronized with public tables.


