Infographics
2024
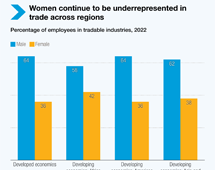
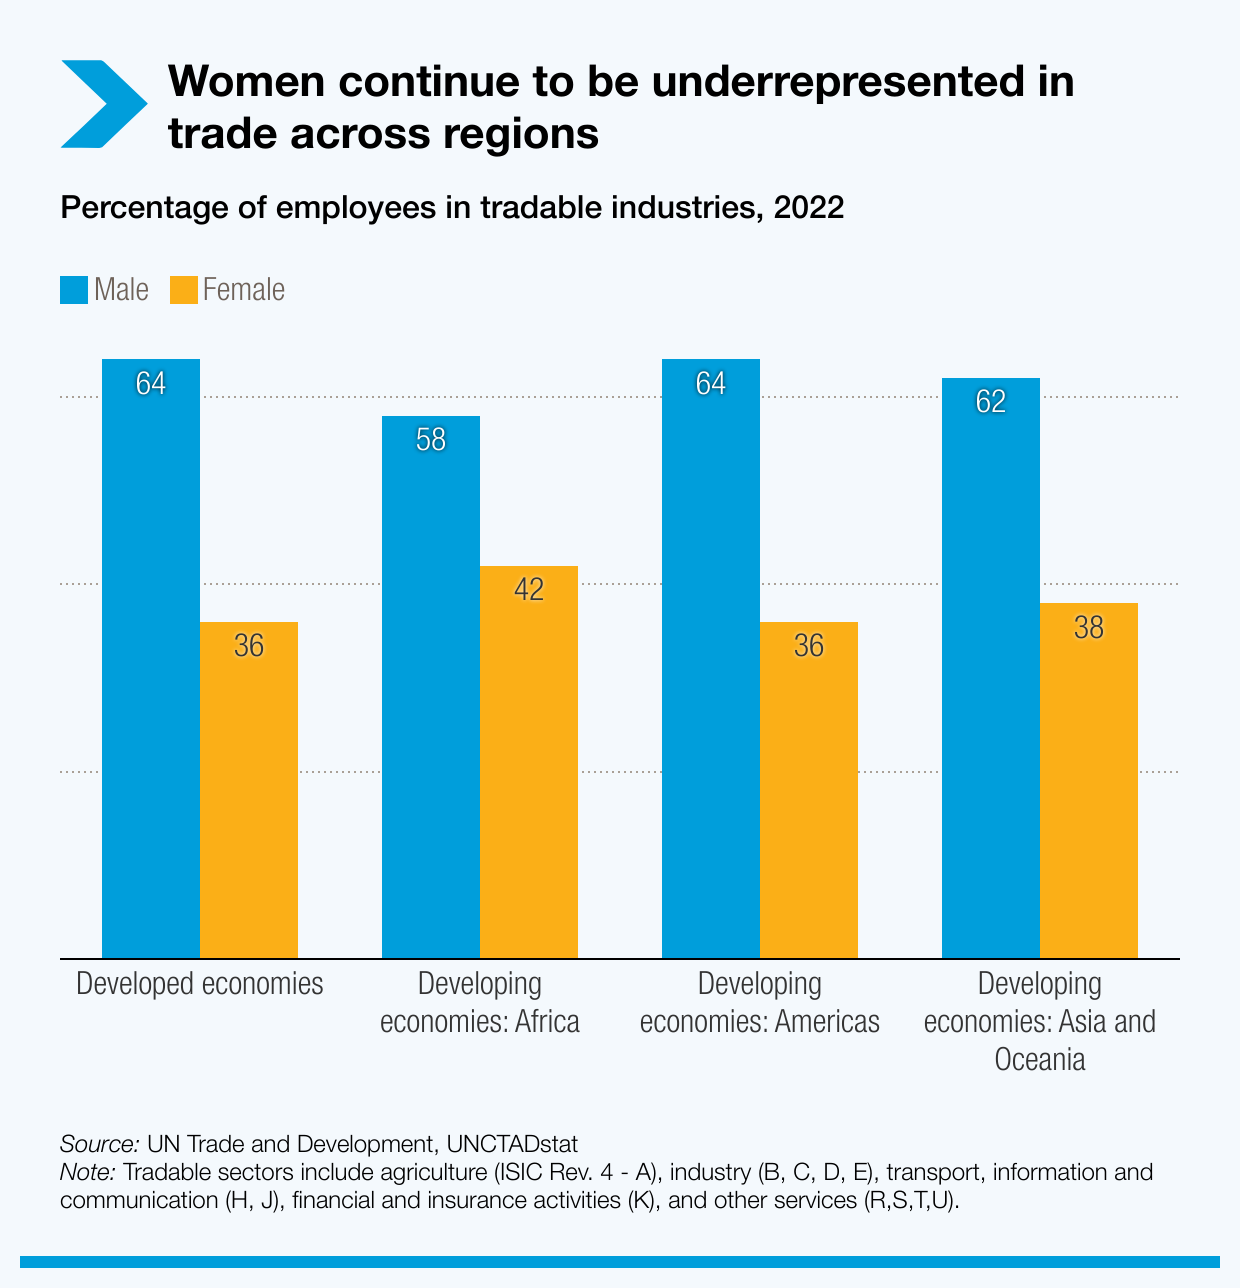
Women employees in
tradable sectors ,
2022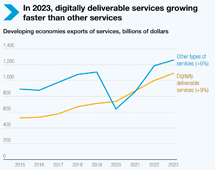
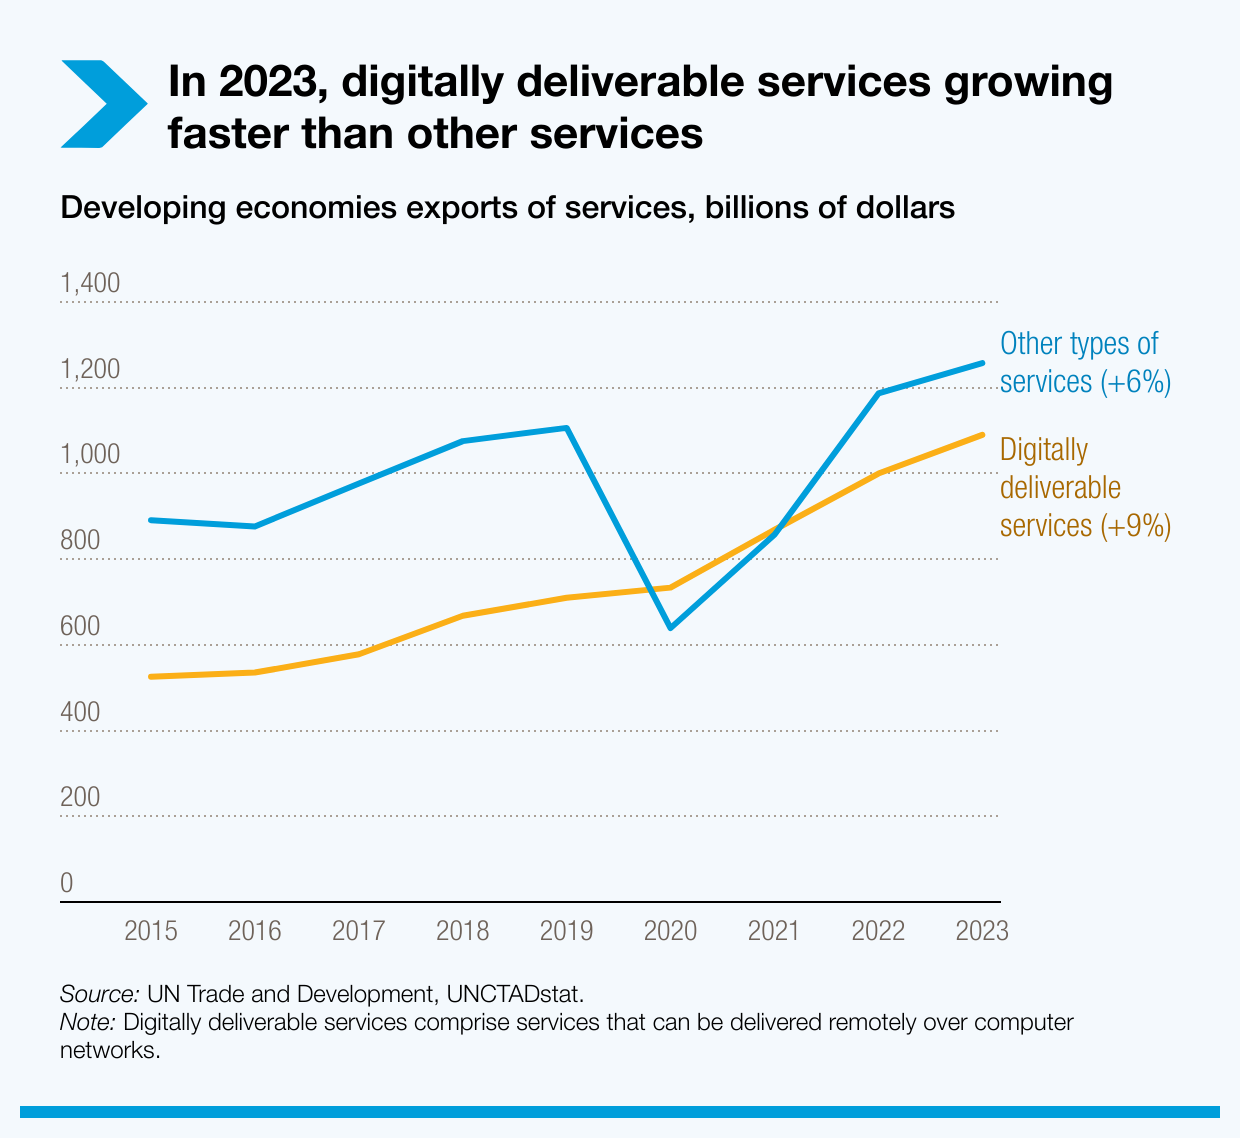
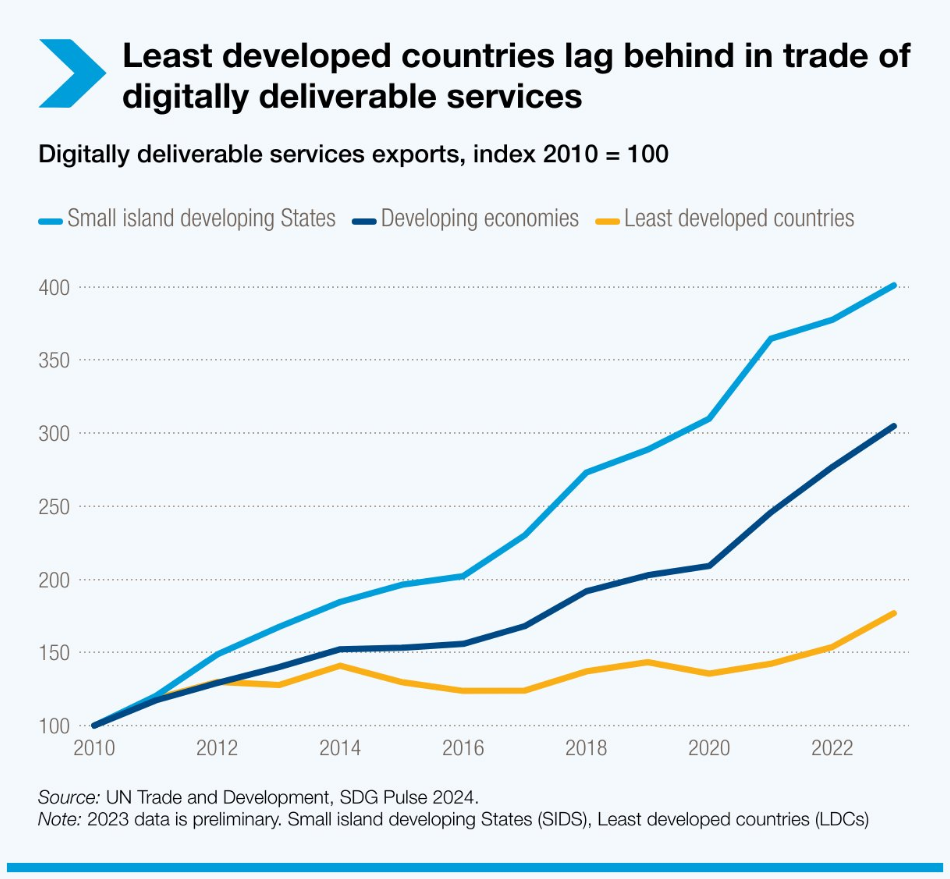
Digitally deliverable
services, 2023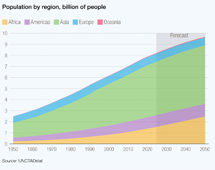
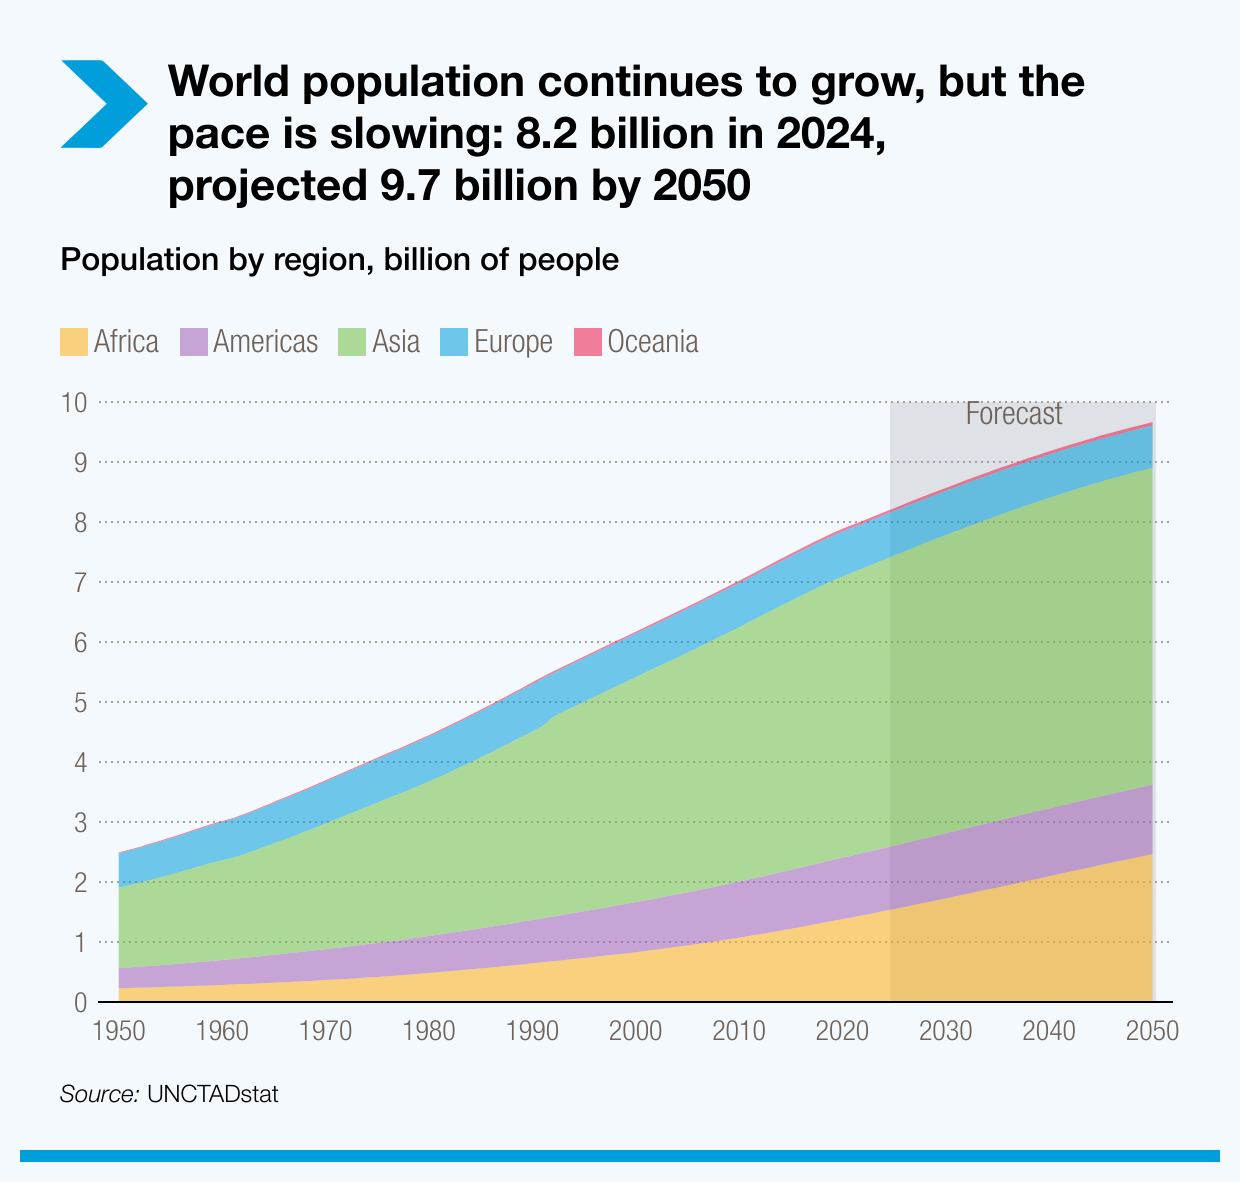
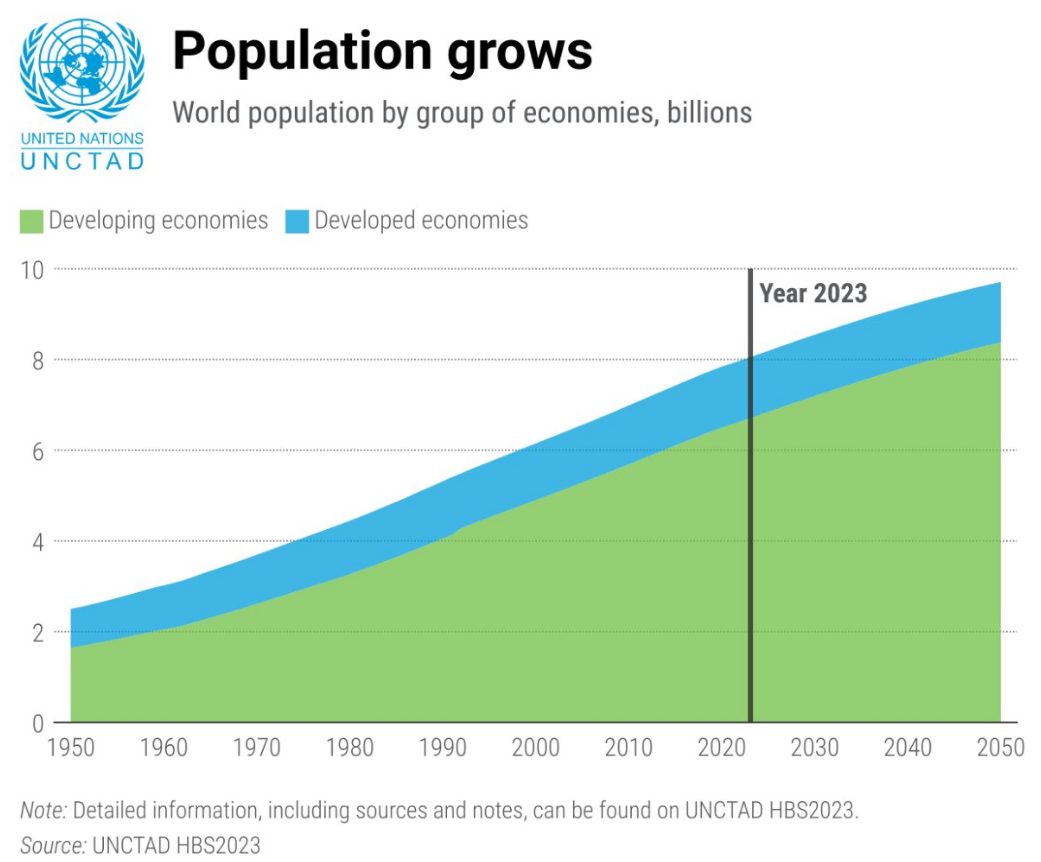
Population growth,
2024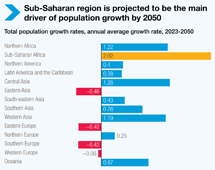
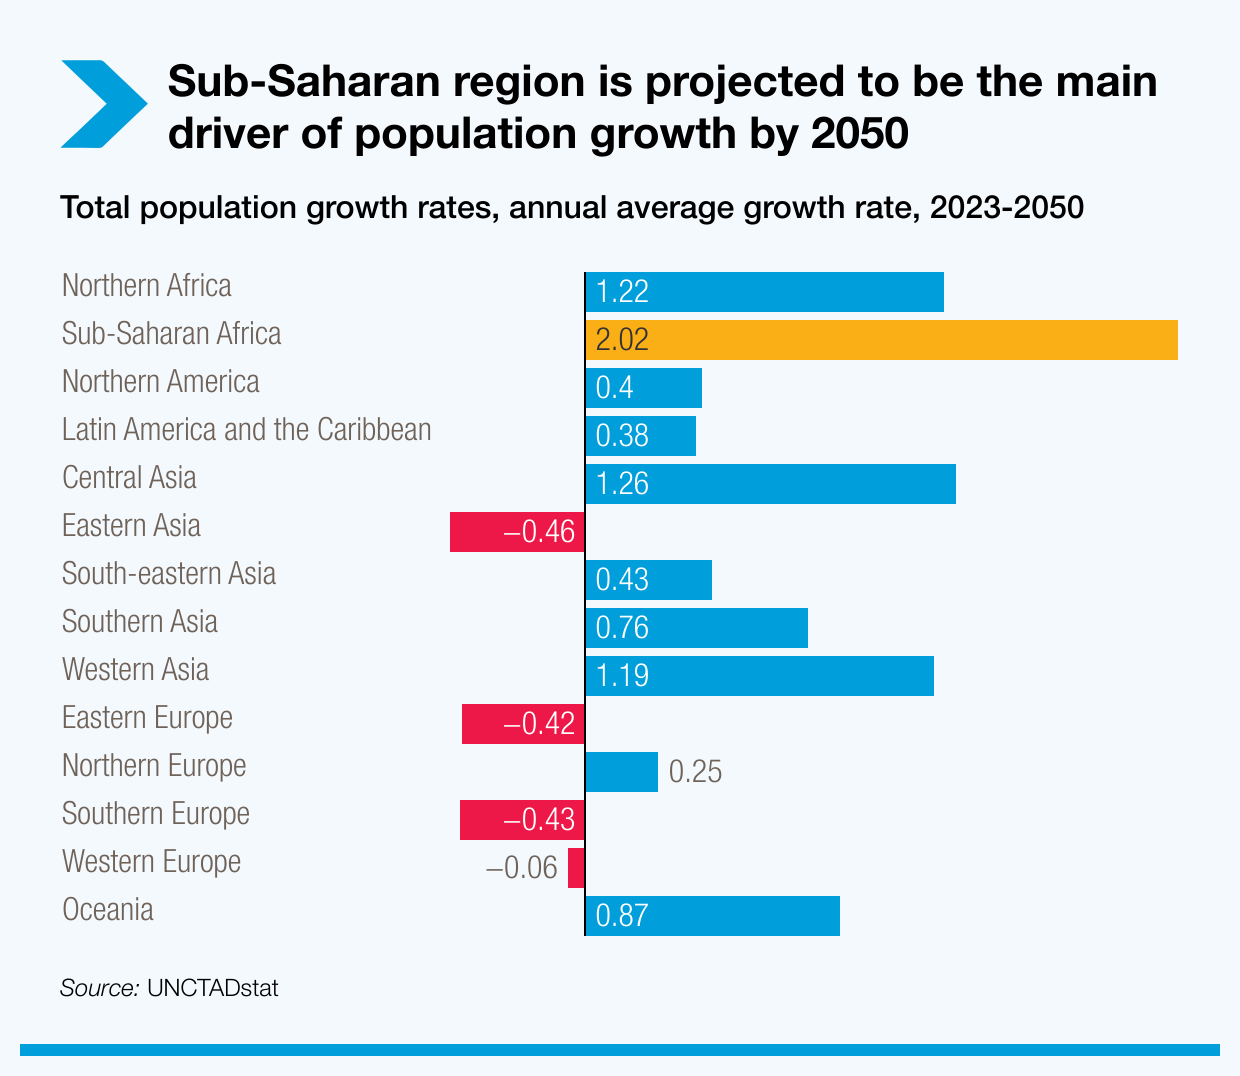
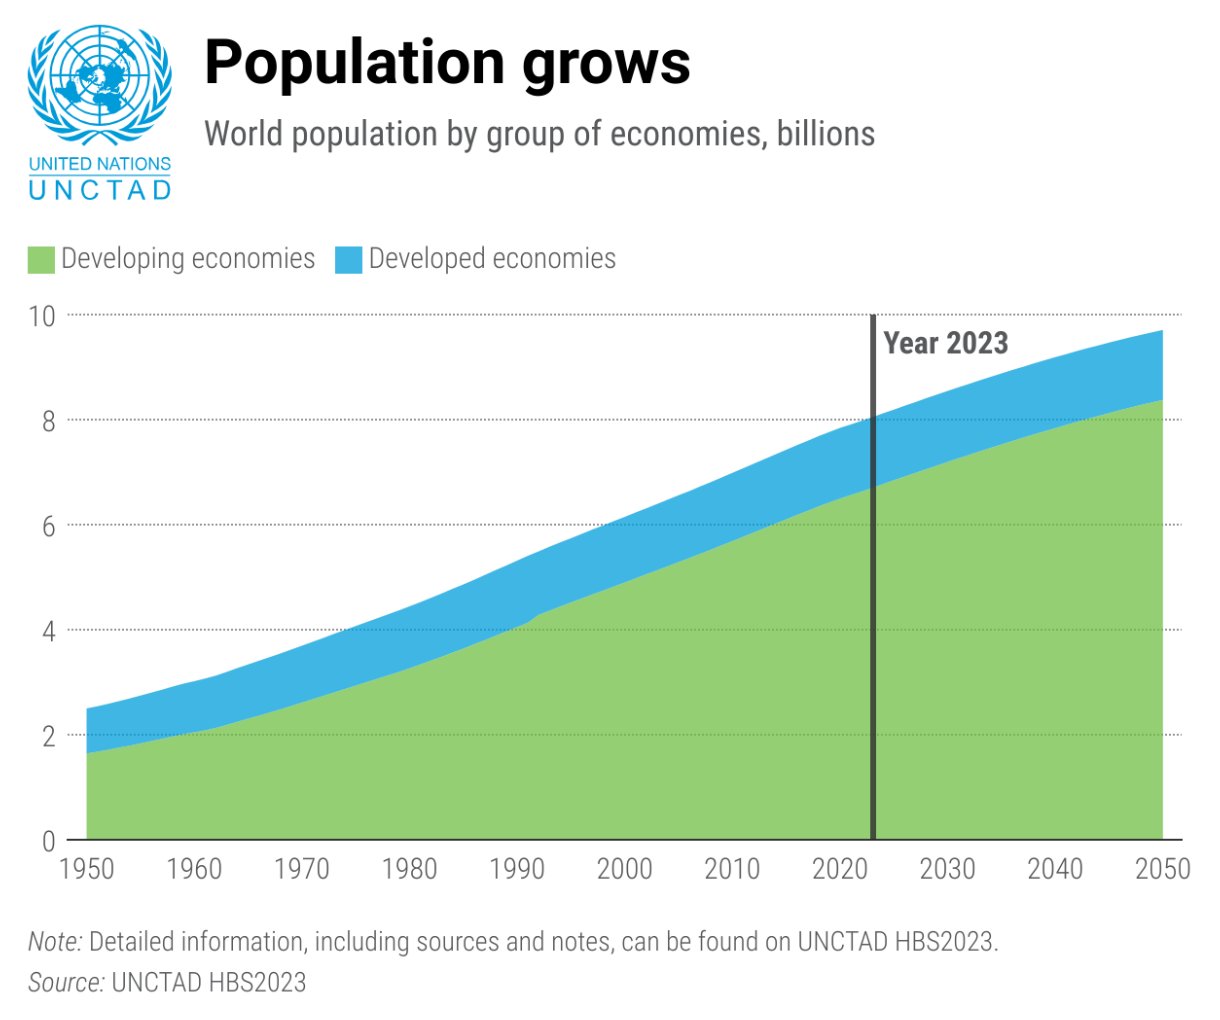
Population growth,
projections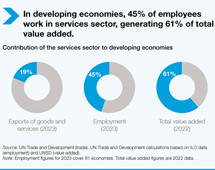
Trade in services,
2023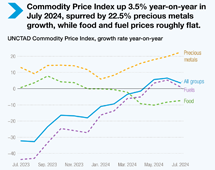
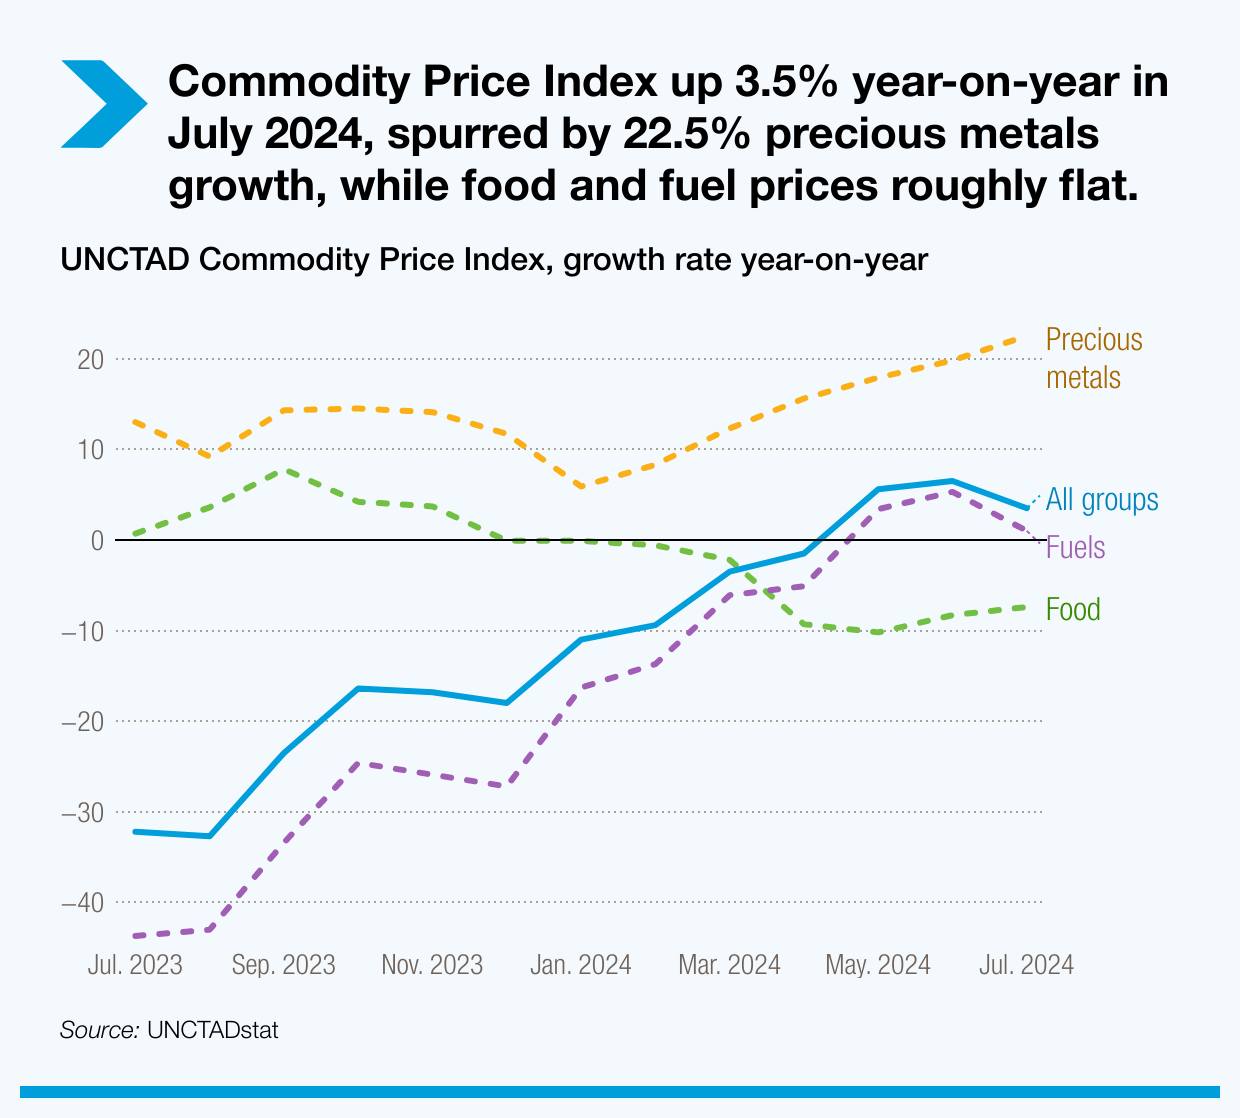
Commodity prices
July 2024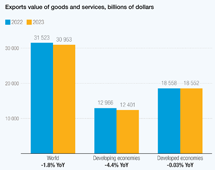
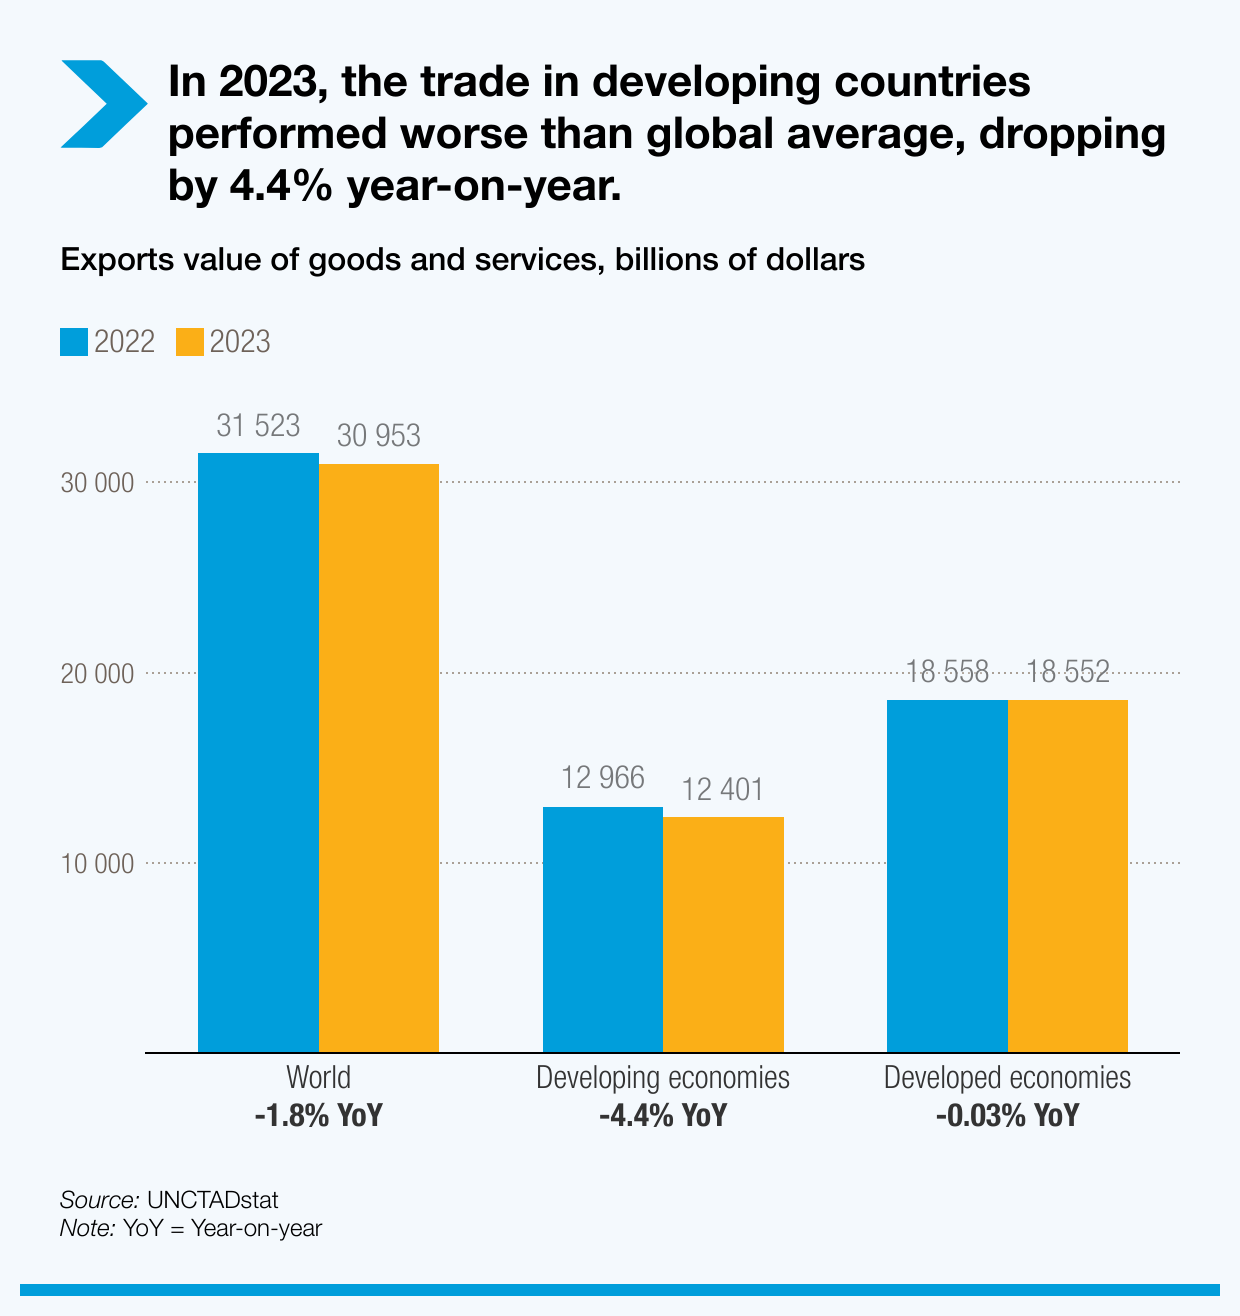
Goods and services,
by region, 2023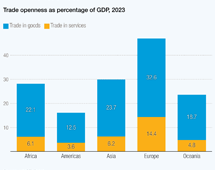
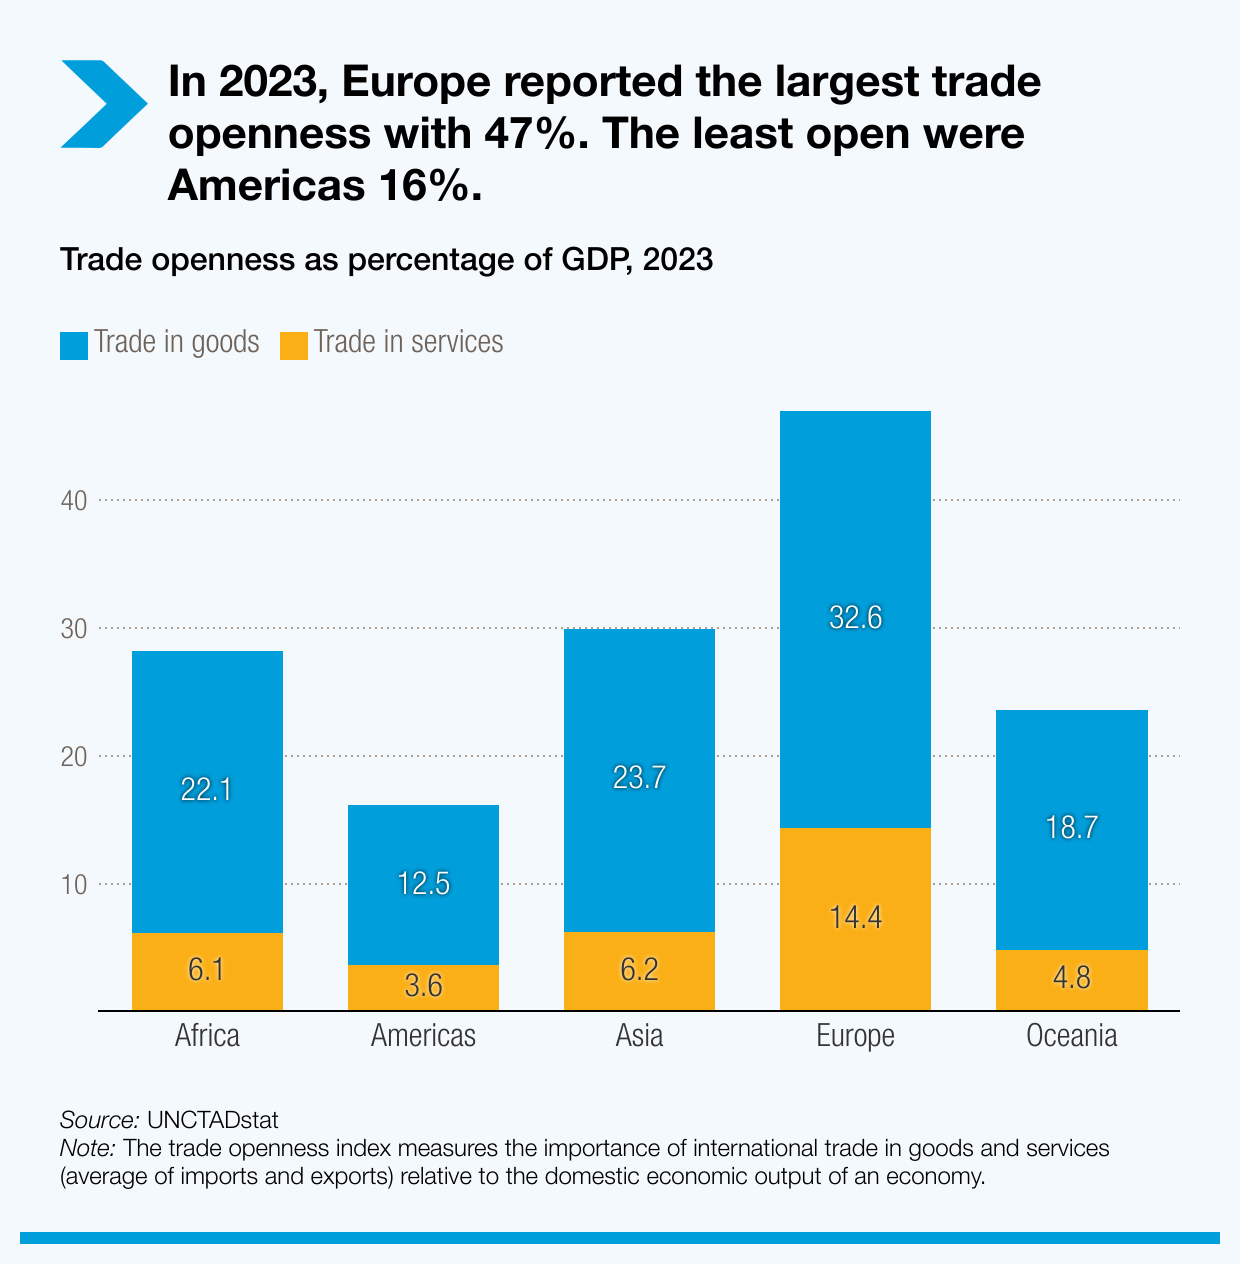
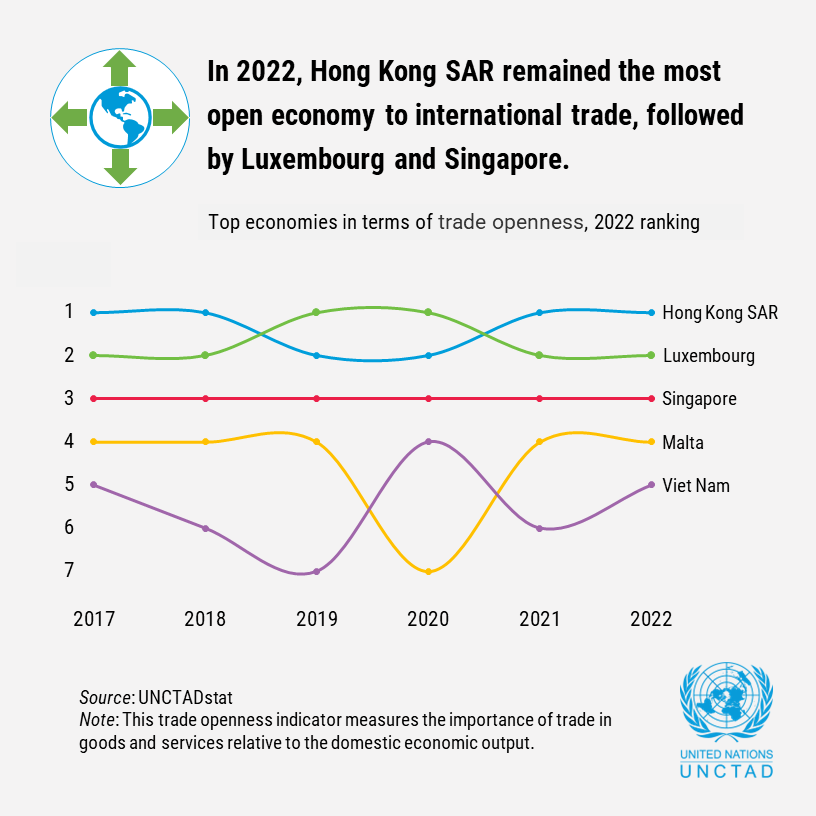
Trade openness,
2023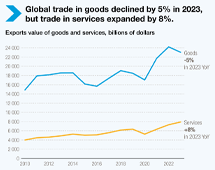
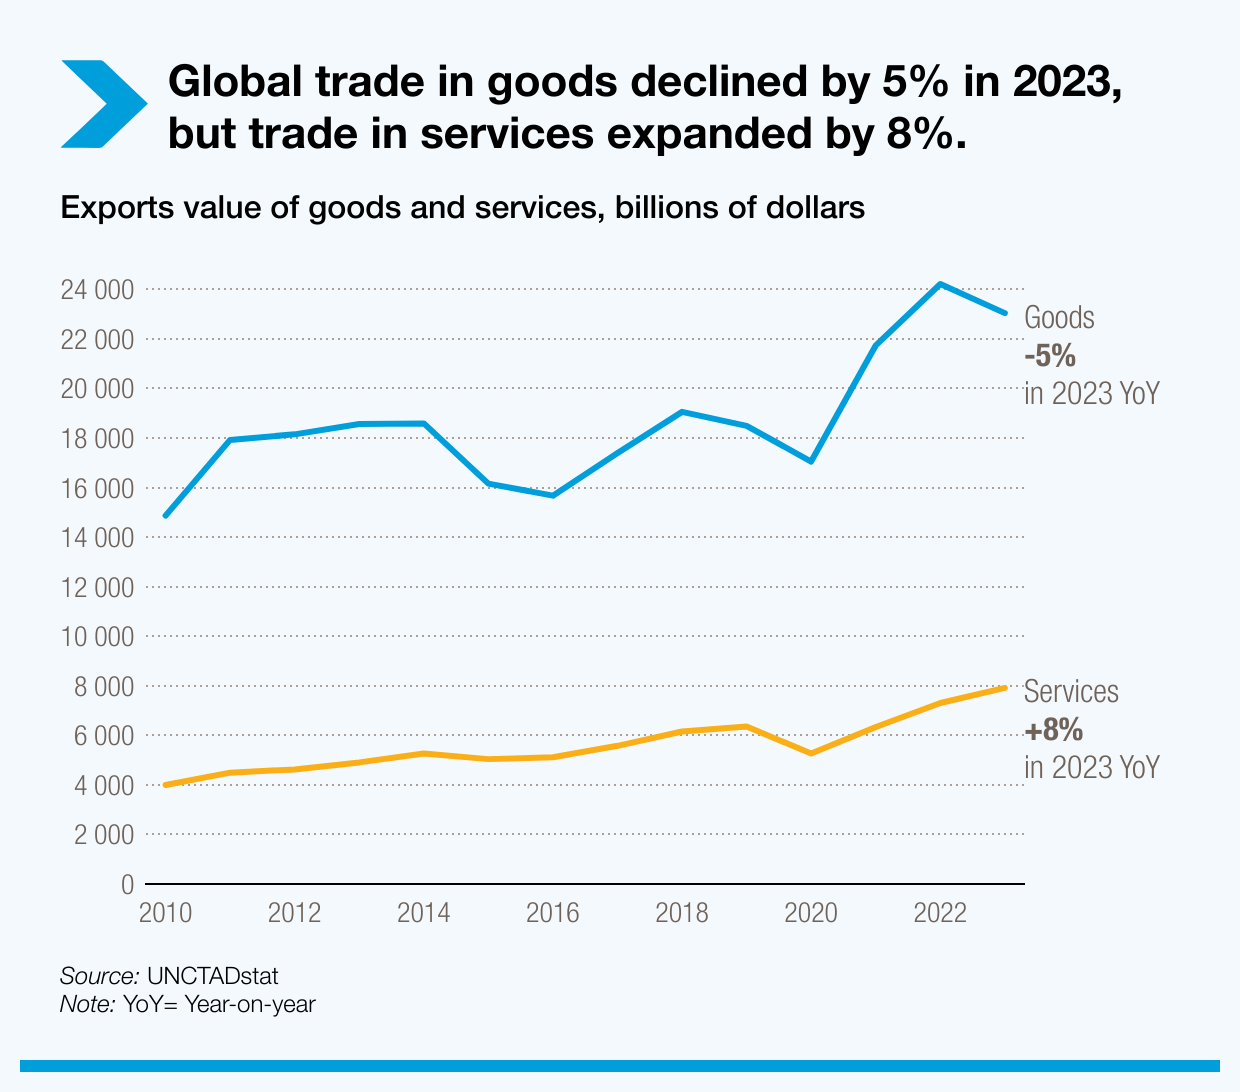
Goods and services,
2023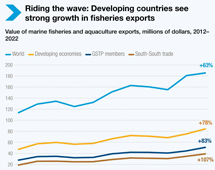
Trade in marine fisheries
and aquaculture, 2022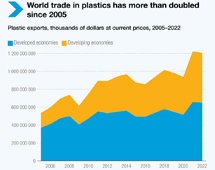
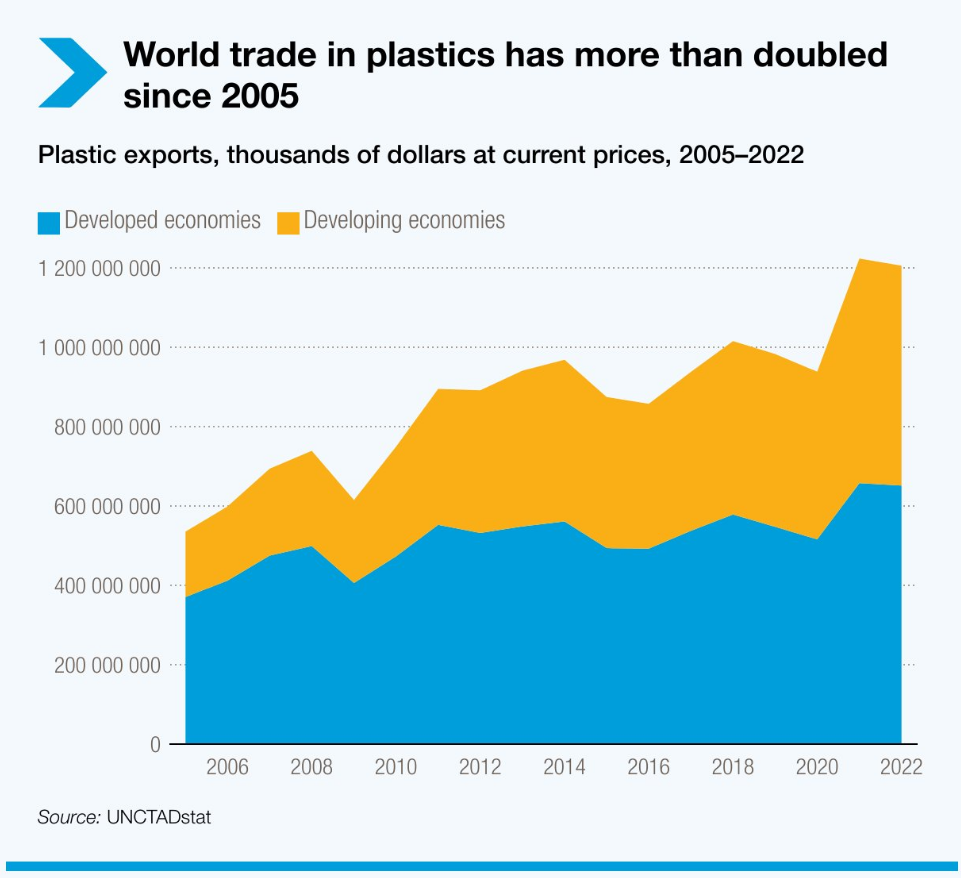
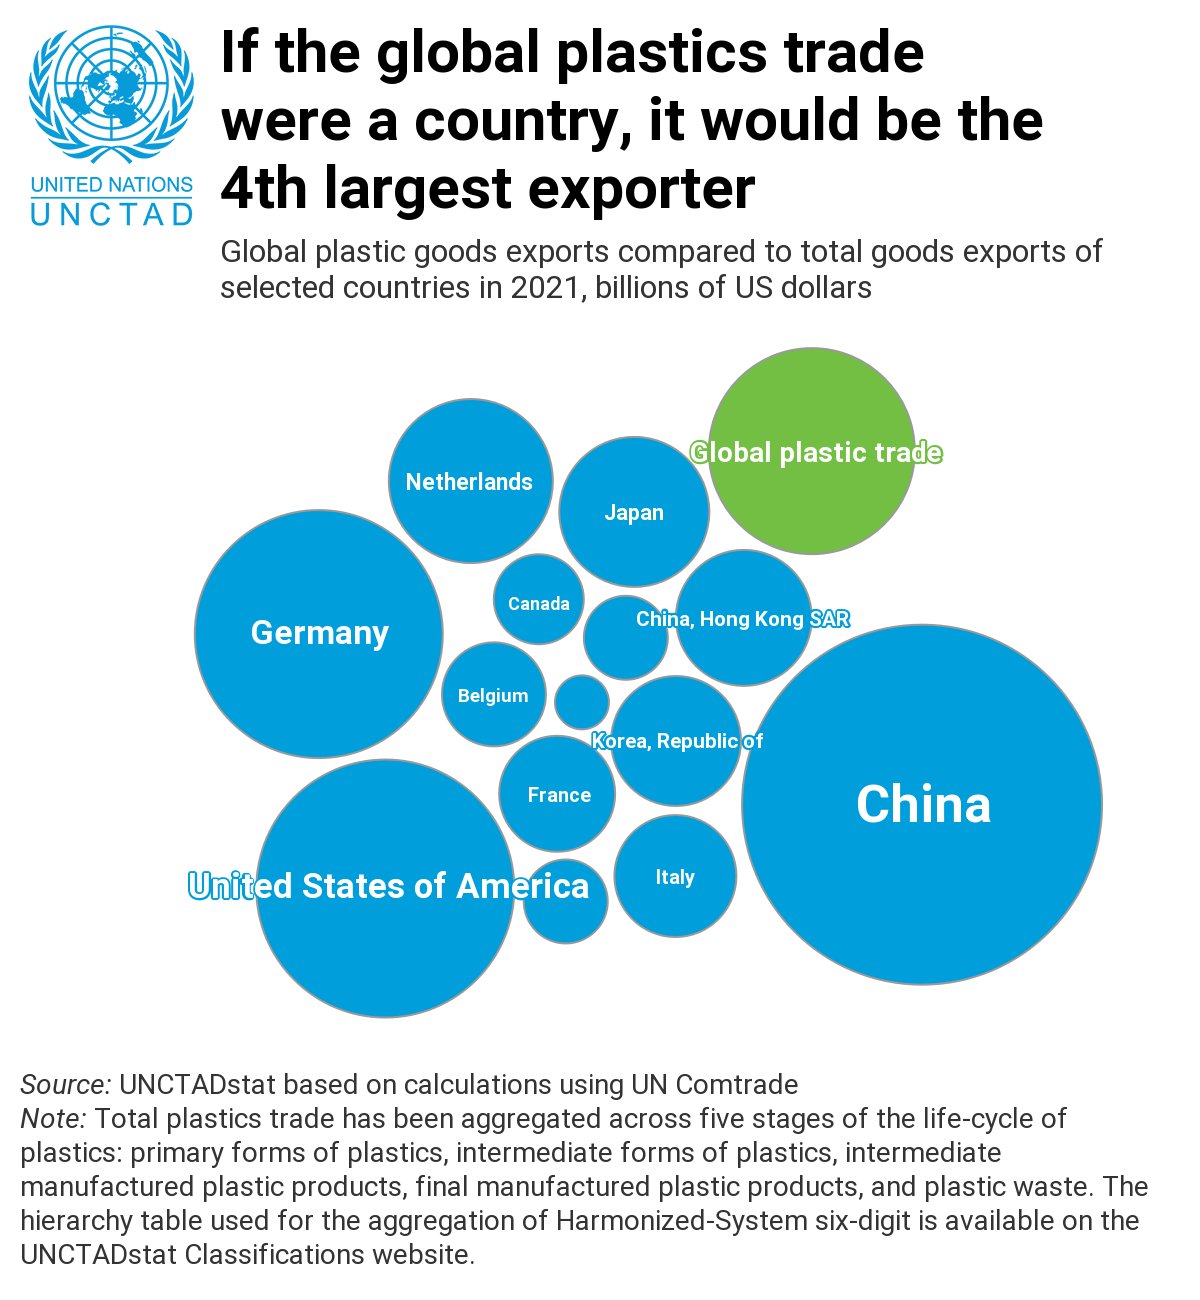
Global plastics trade,
2022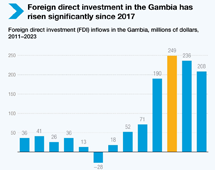
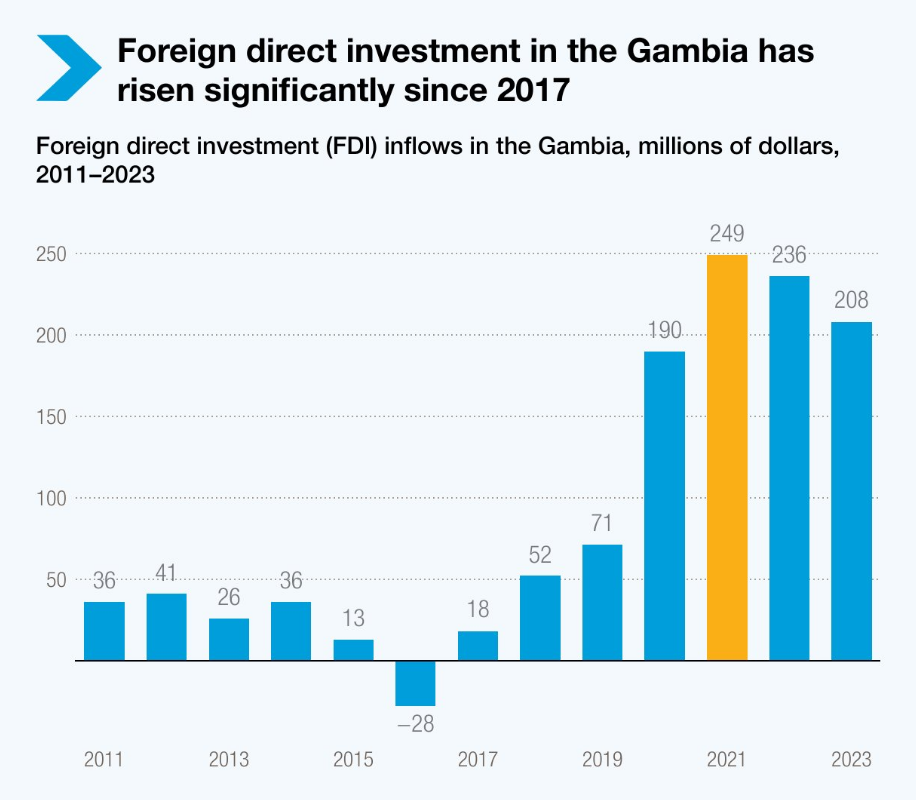
Foreign Direct Investment
in Gambia, inflows, 2023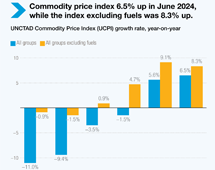
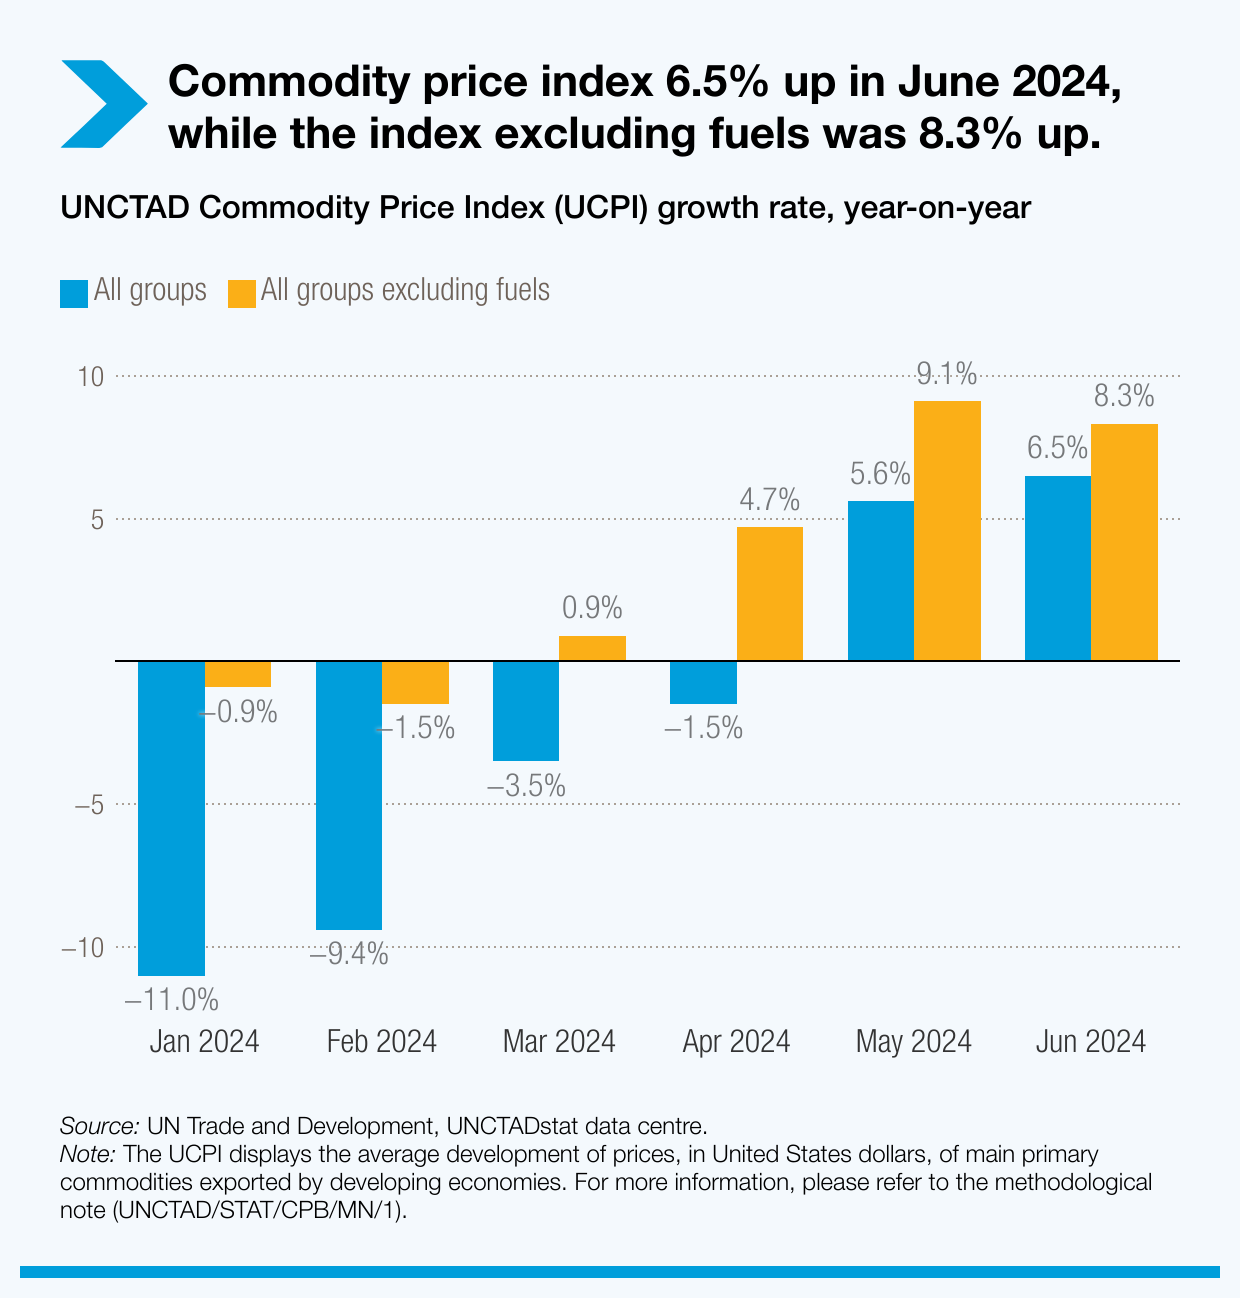
Commodity prices
June 2024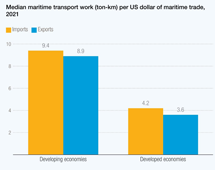
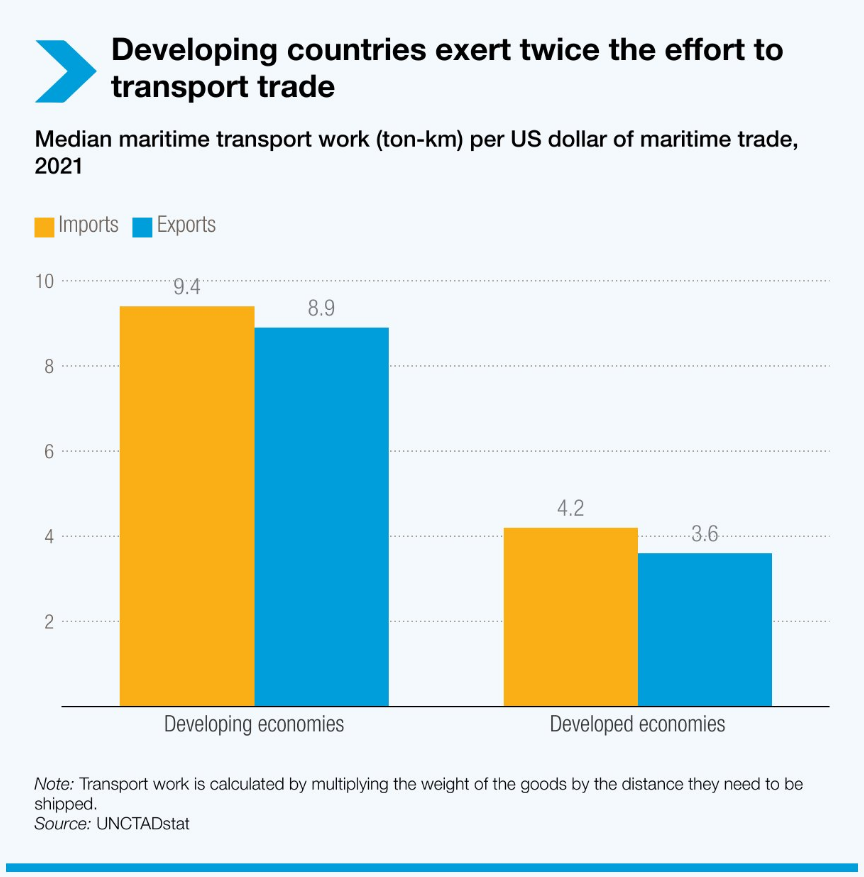
Median maritime
transport work - 2021
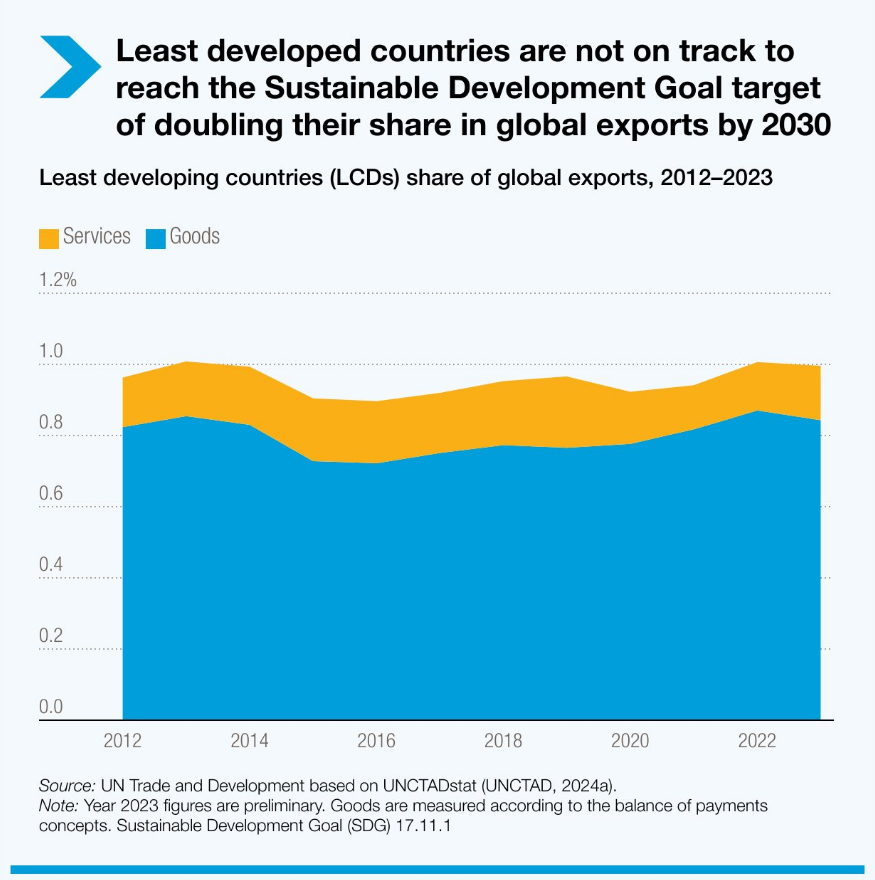
Goods and services
shares, 2023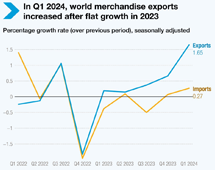
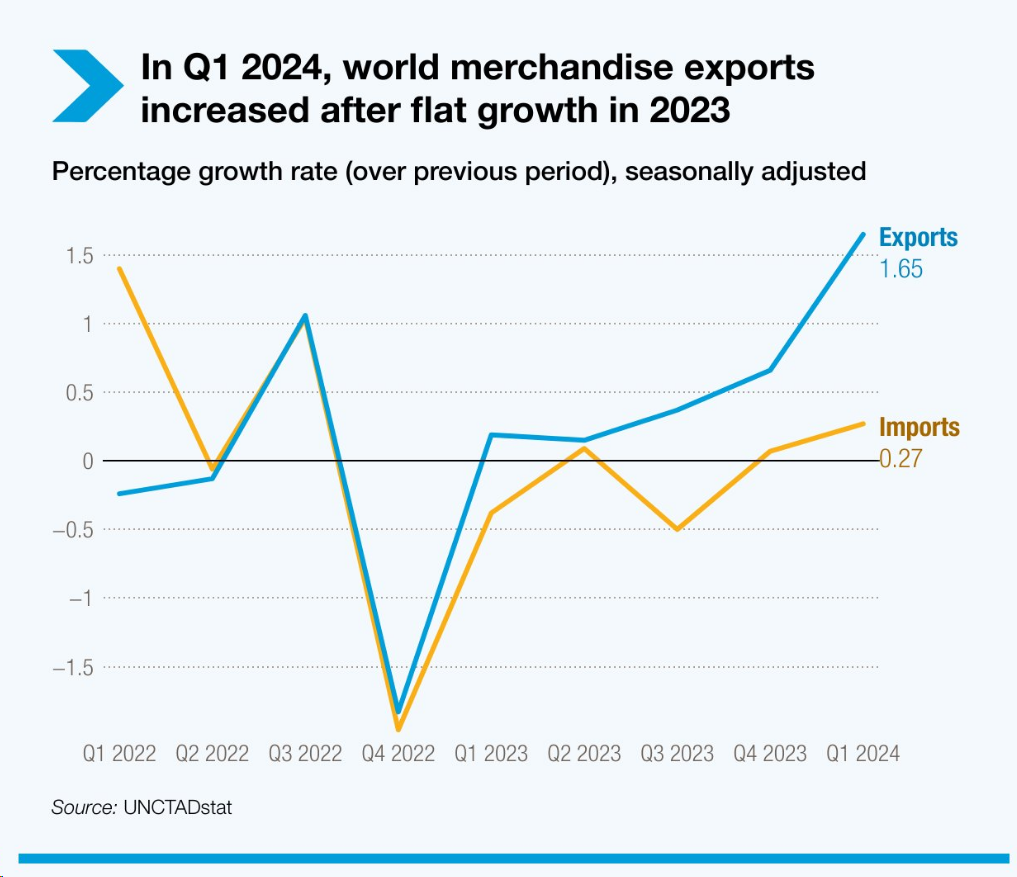
Volume of merchandise
exports, 2024 Q1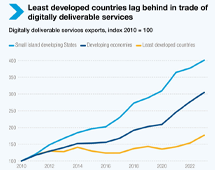
Digitally deliverable
services, 2022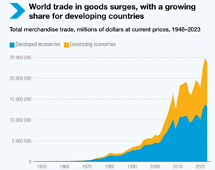
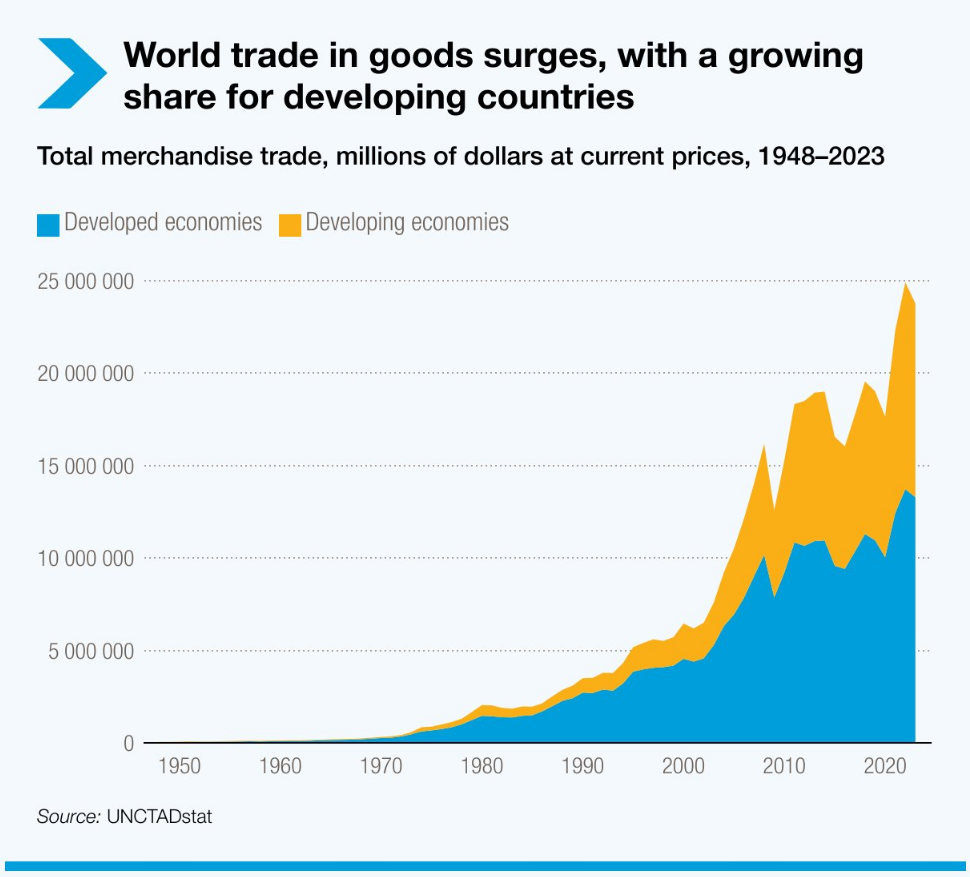
Total merchandise
trade, 2023Maritime transport and
insurance costs, 2021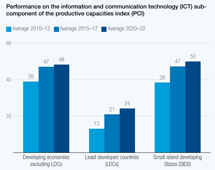
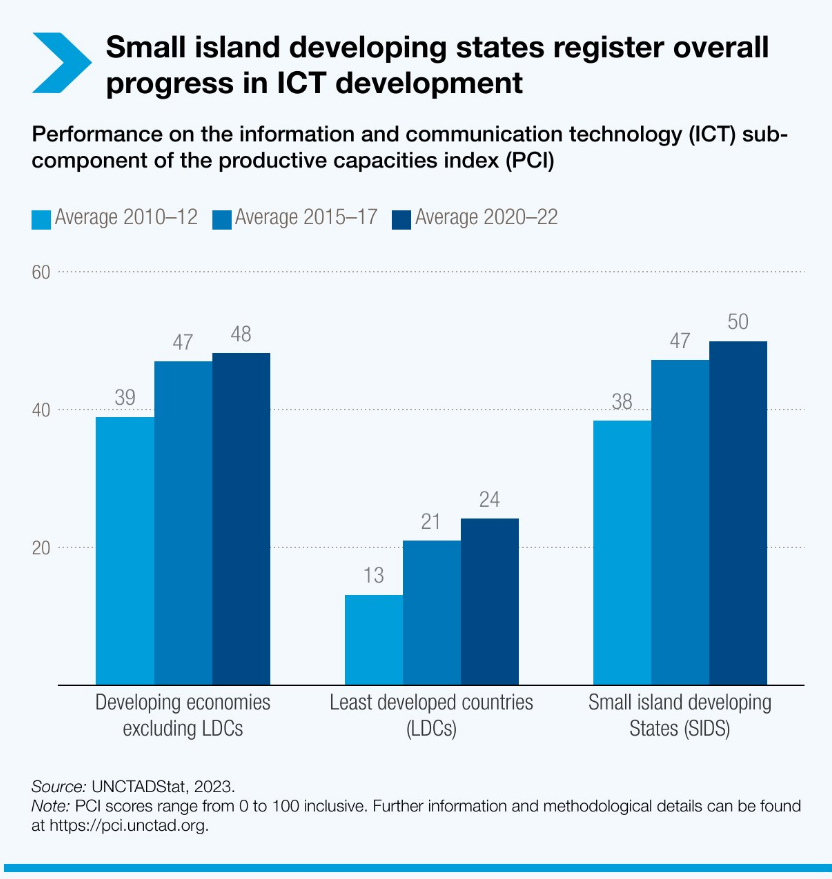
Productive capacity
index, 2022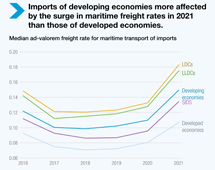
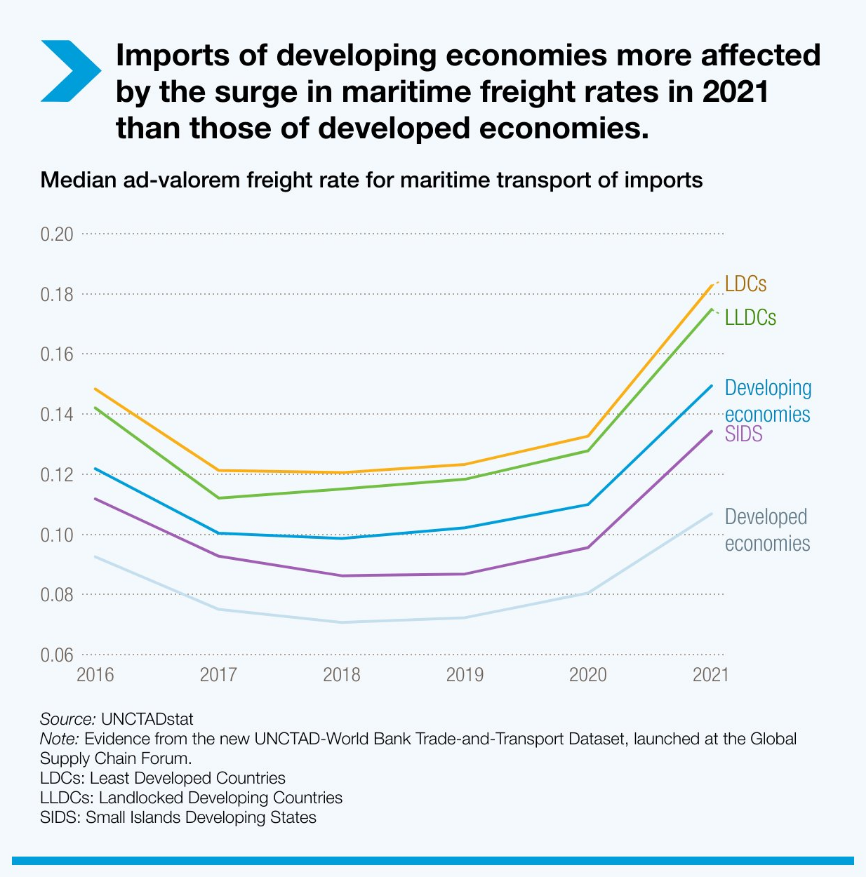
Maritime freight
rates, 2021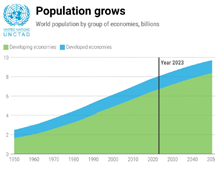
Population growth,
2022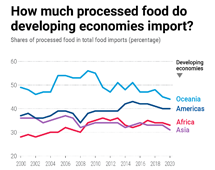
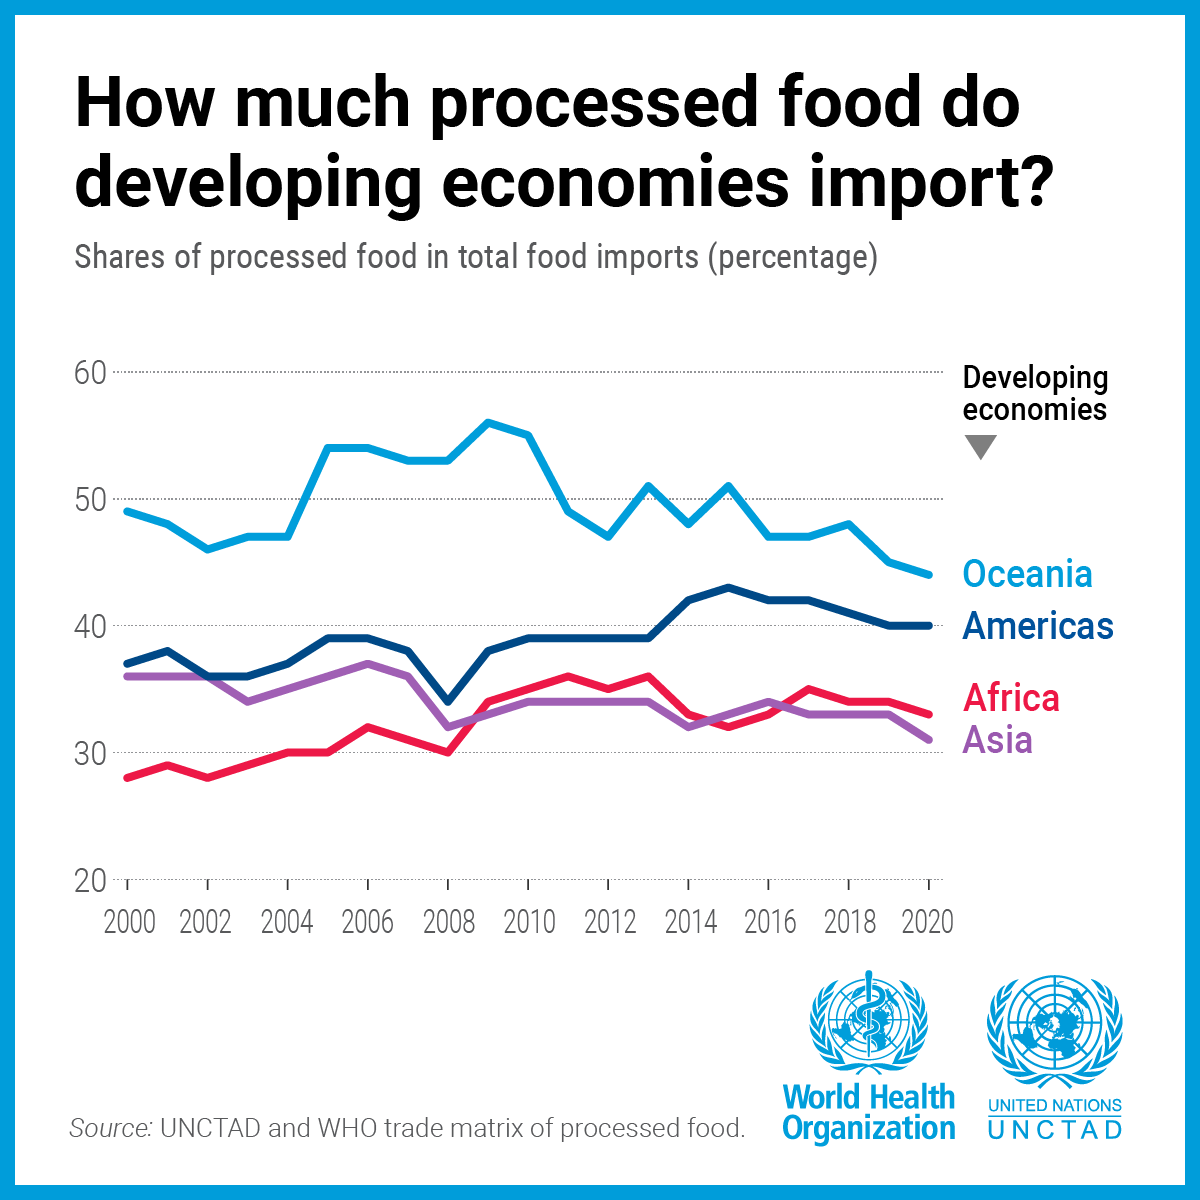
Trade in processed food:
Developing economies
imports, 2021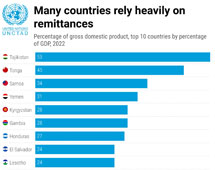
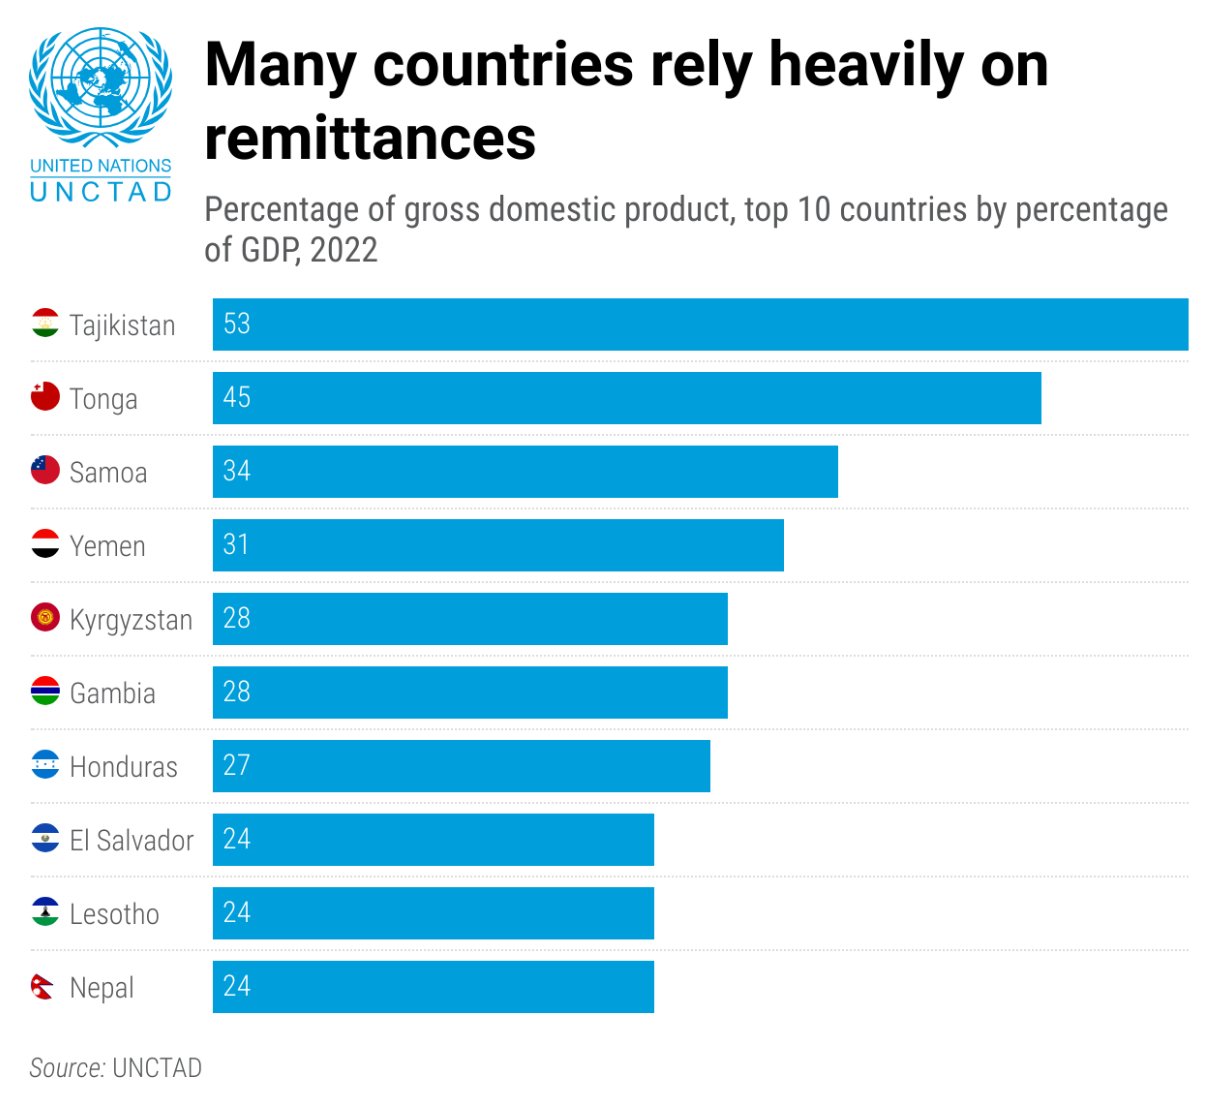
Personal remittances:
receipts and payments, 2022
2023
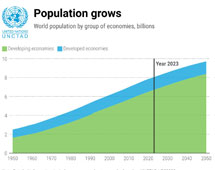
World population, 2022
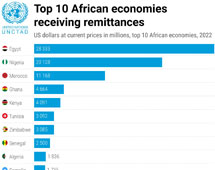
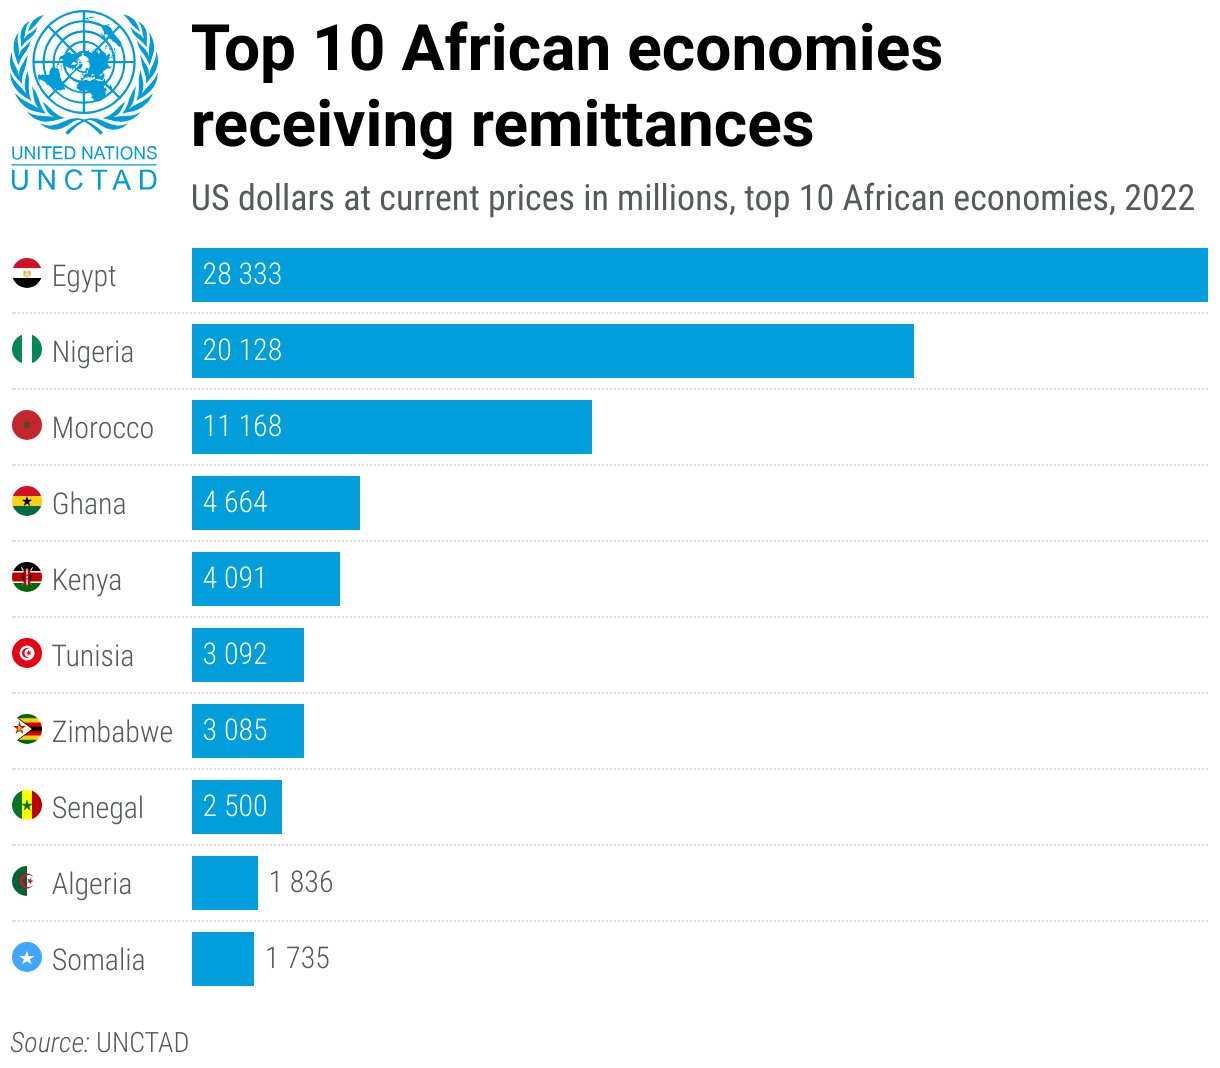
Personal remittances:
receipts in Africa, 2022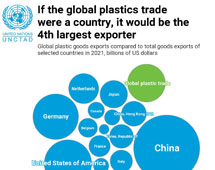
Global plastics trade,
2021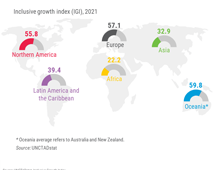
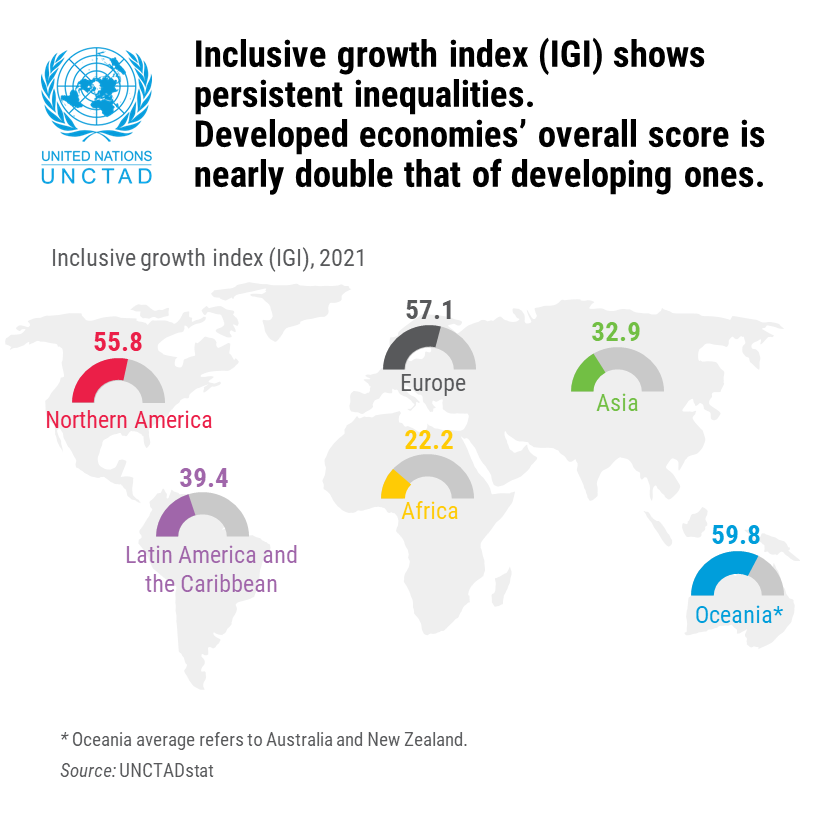
Inclusive growth index
by region, 2021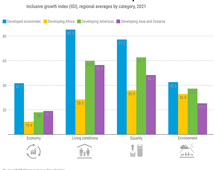
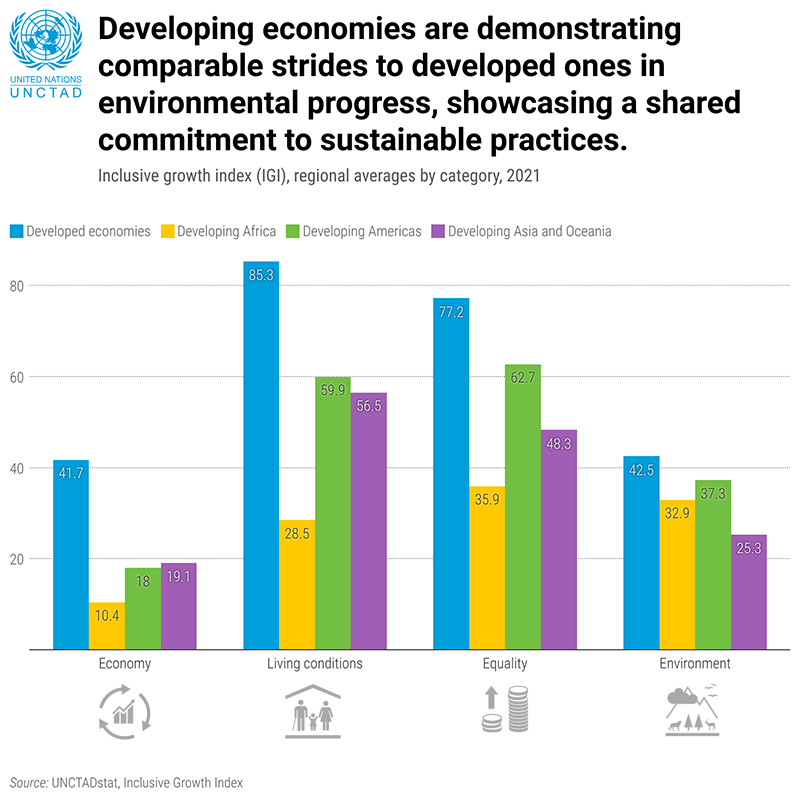
Inclusive growth index
by category, 2021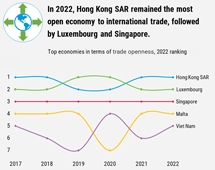
Goods and services
trade openness, 2022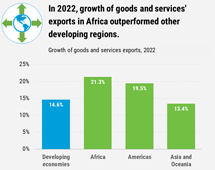
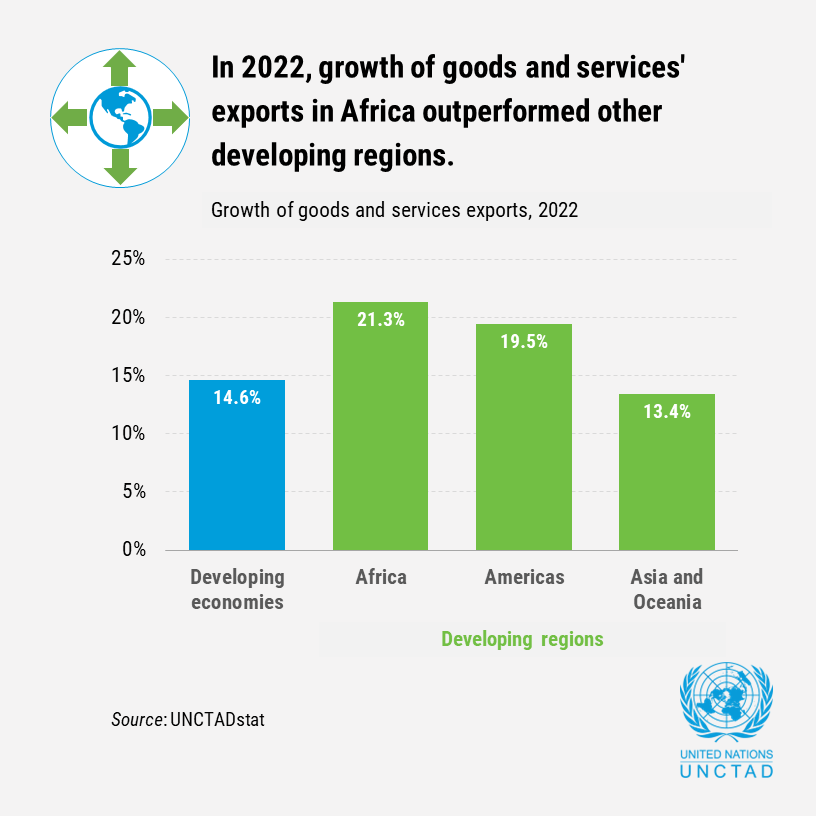
Goods and services
growth, 2022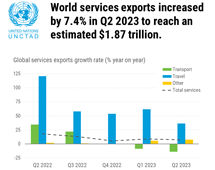
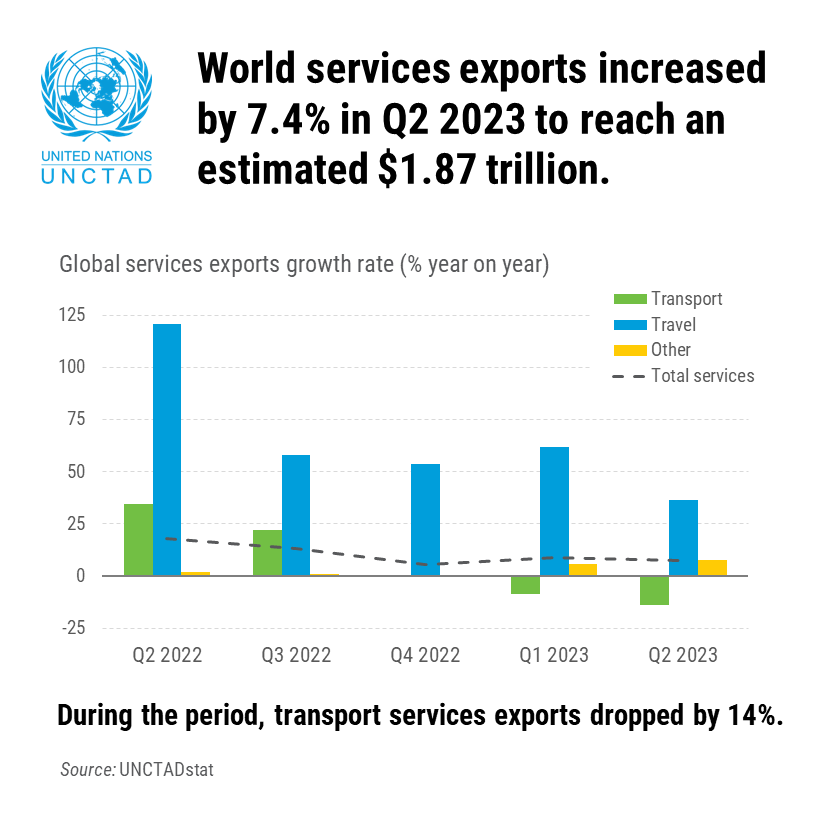
Trade in services
quarterly, Q2 2023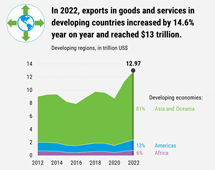
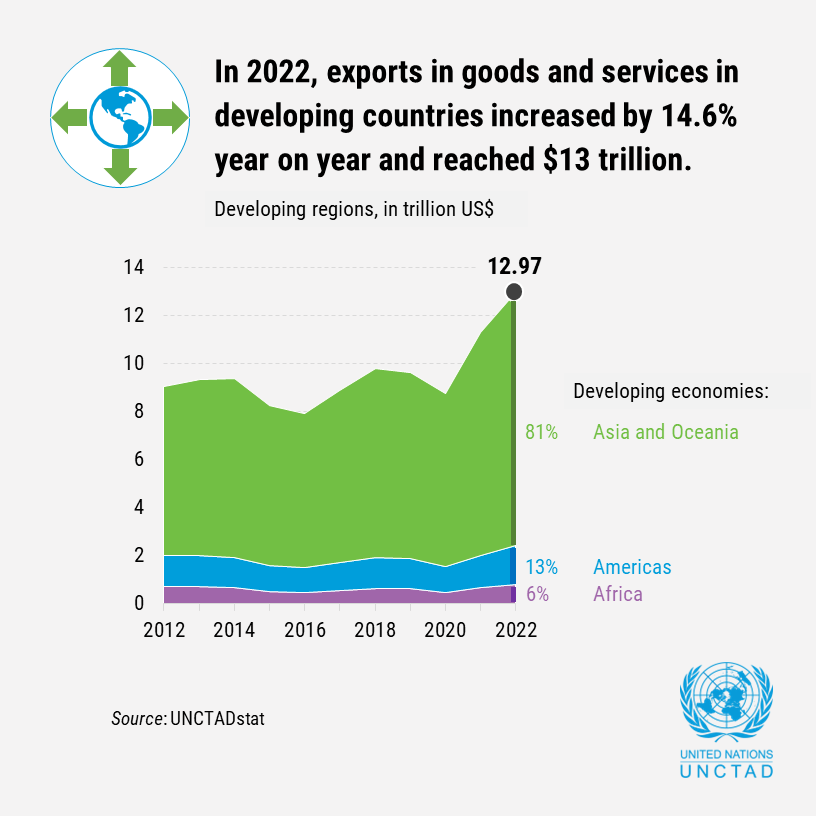
Goods and services
value, 2022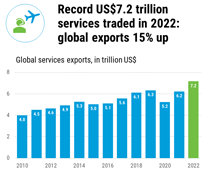
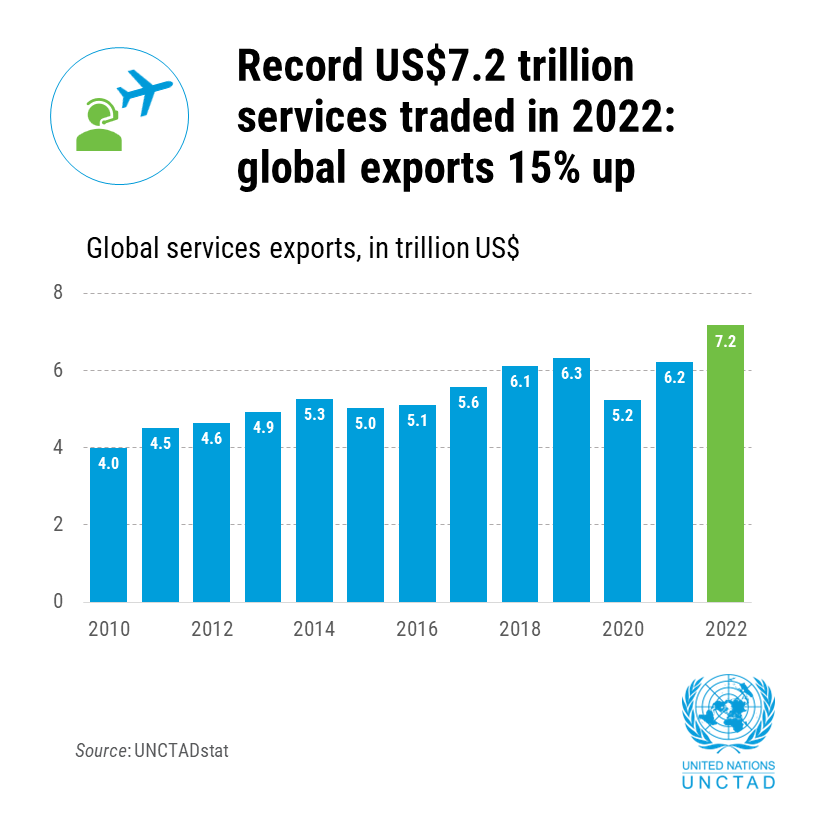
Trade in services,
preliminary, 2022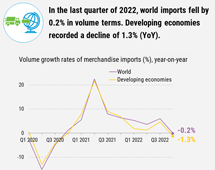
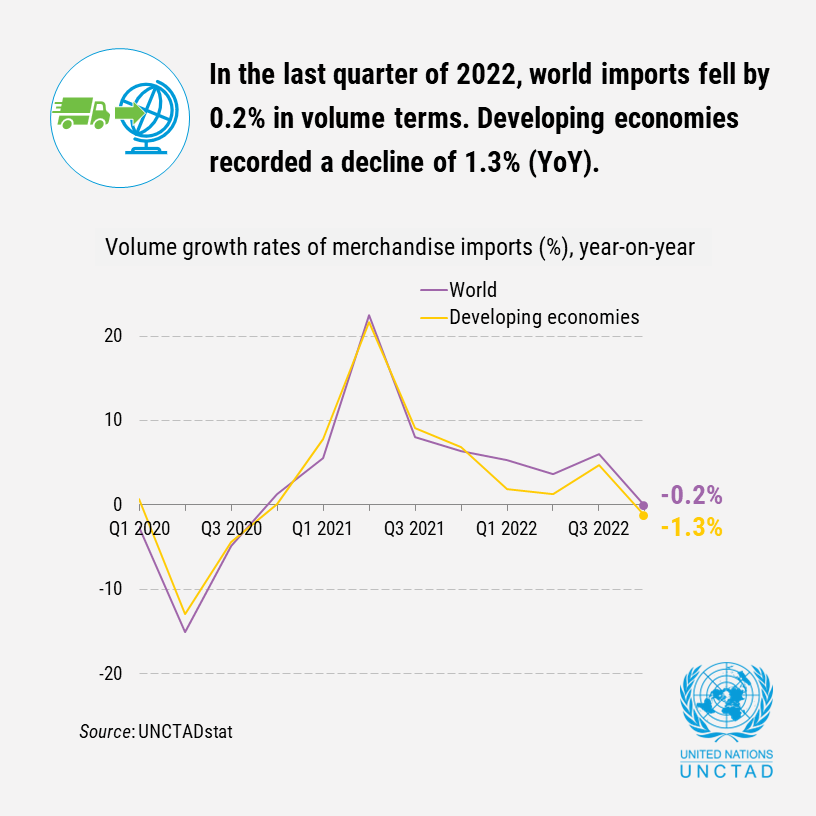
Volume of merchandise
imports, 2022 Q4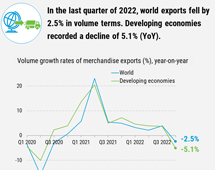
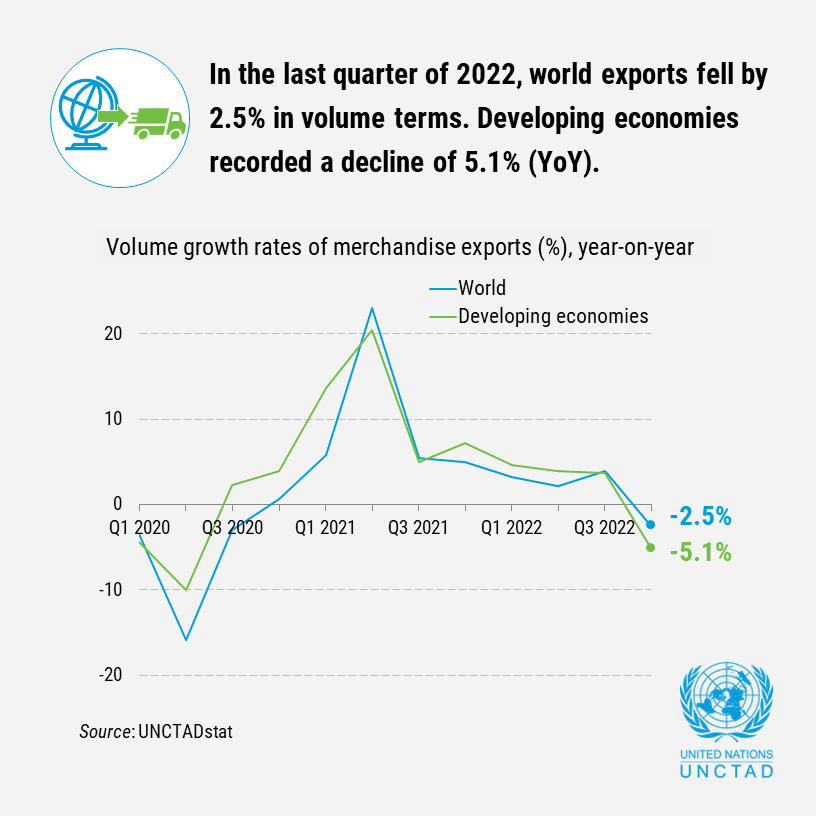
Volume of merchandise
exports, 2022 Q4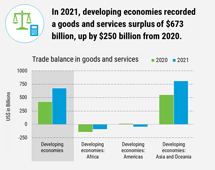
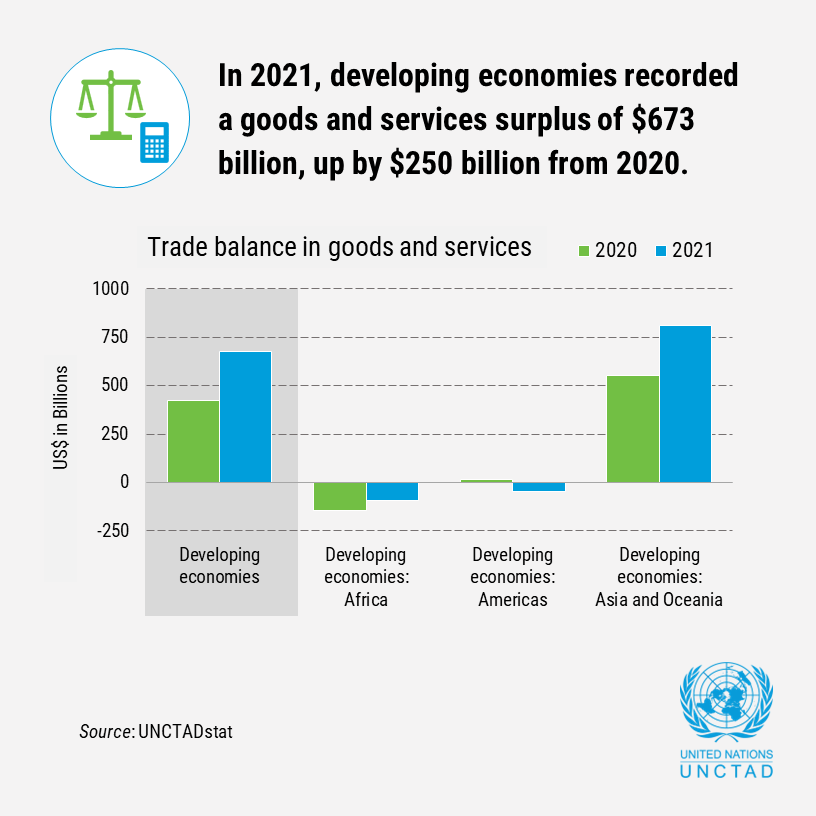
Goods and services
balance, 2021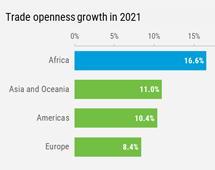
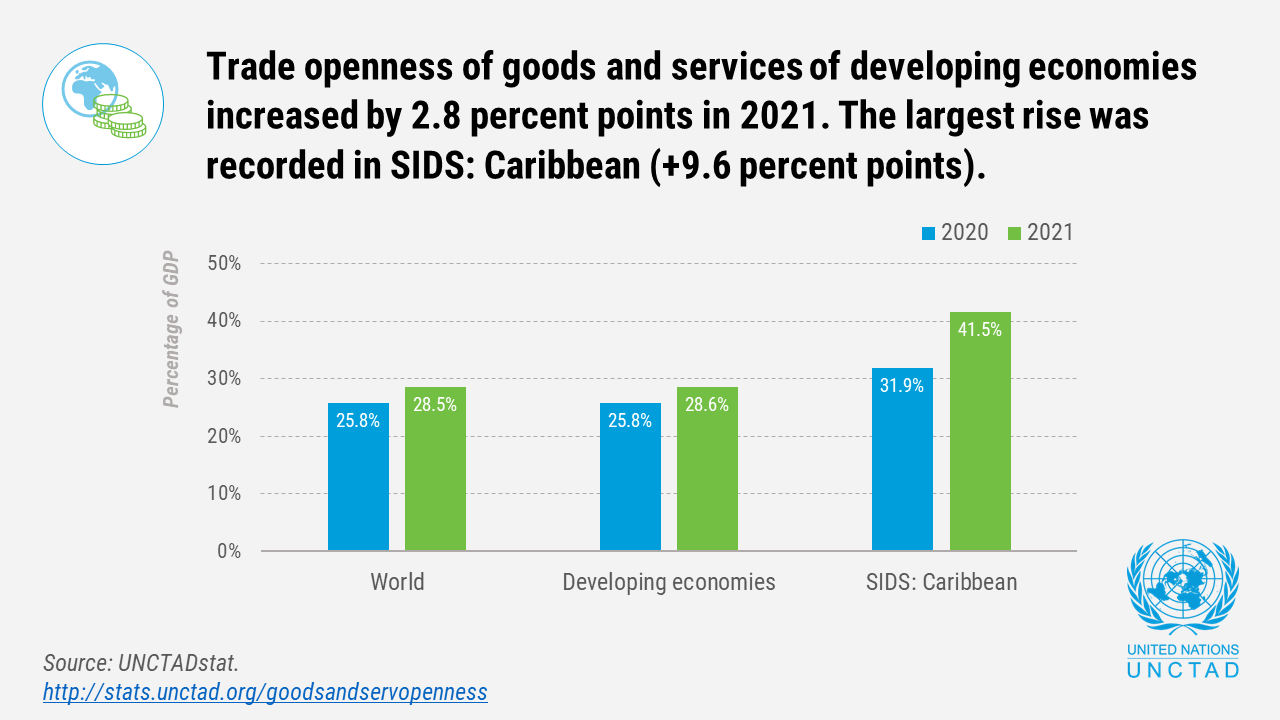
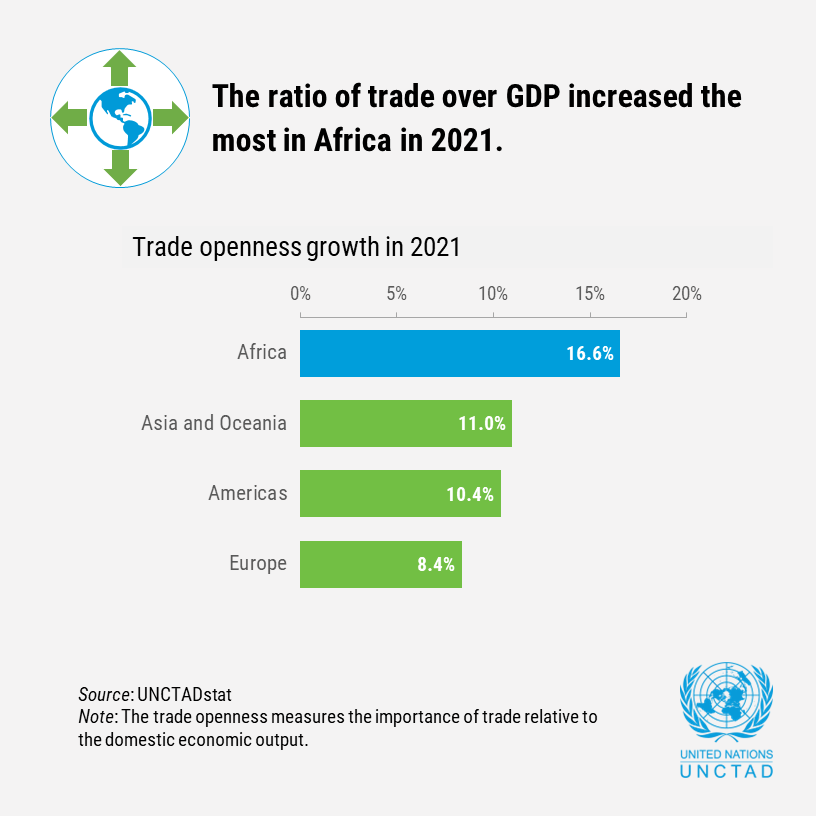
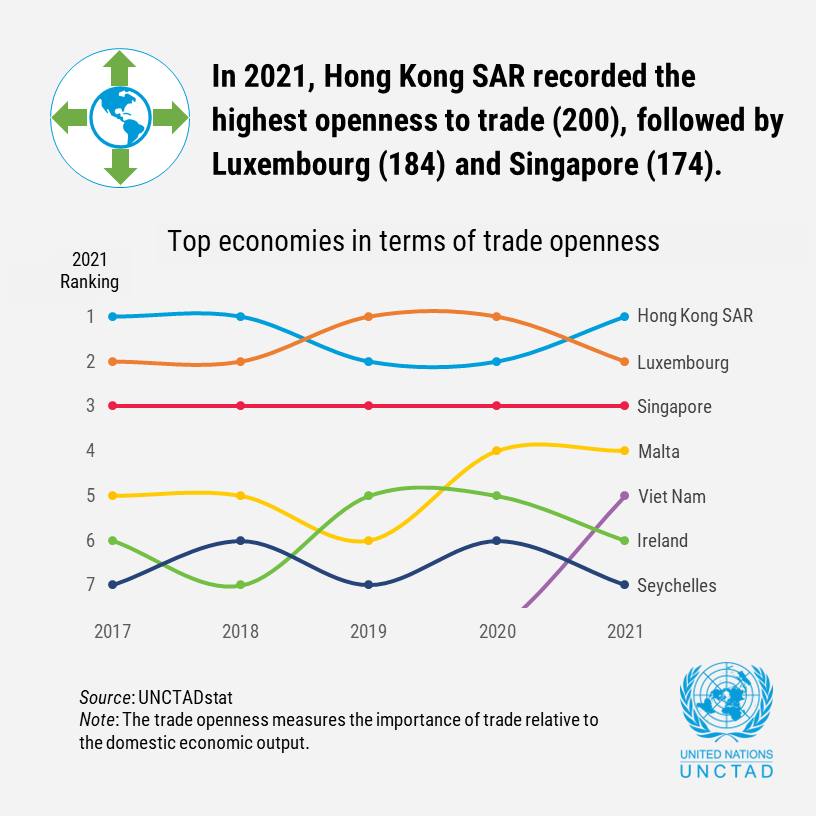
Goods and services
trade openness, 2021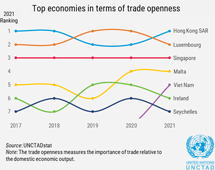
Goods and services
highest openness, 2021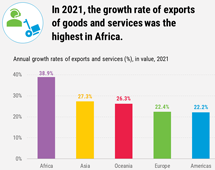
Goods and services
growth, 2021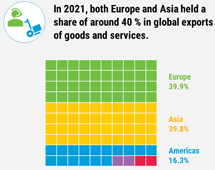
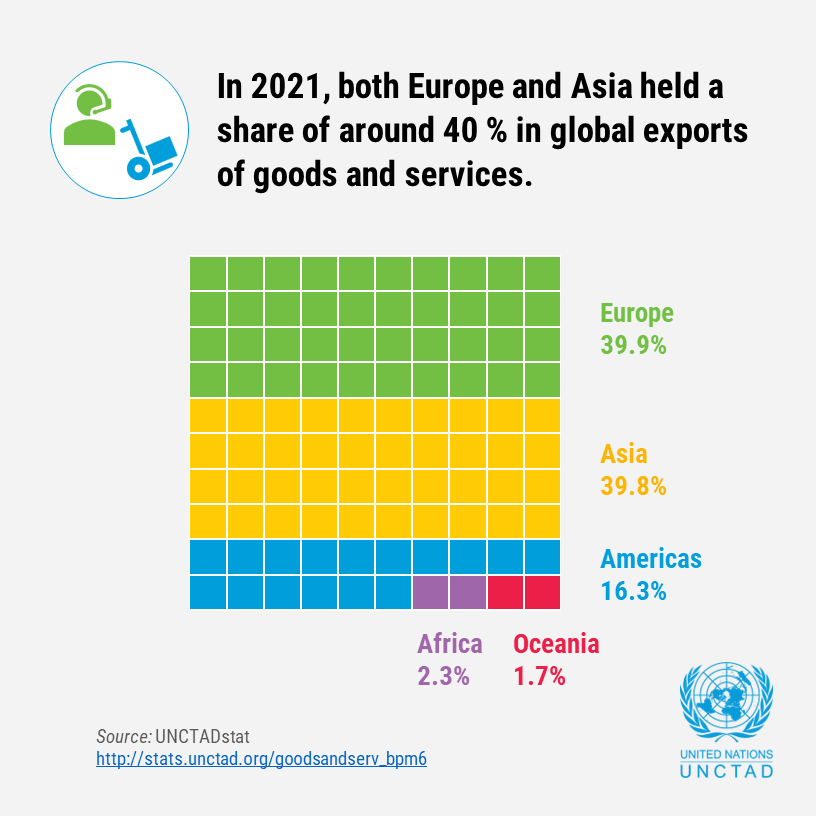
Goods and services
share, 2021

2022
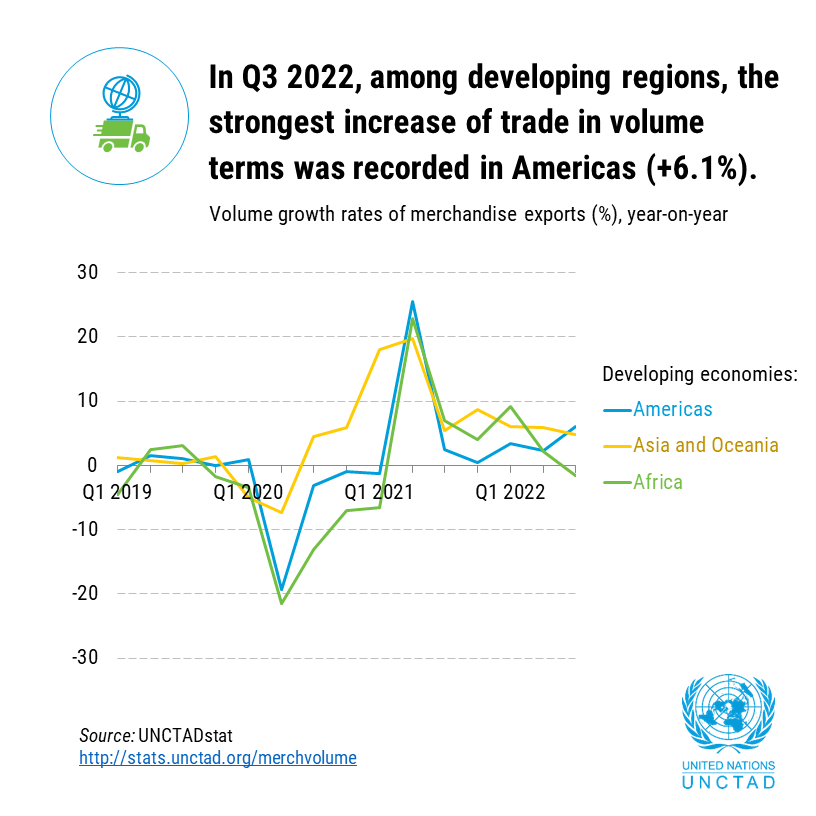
Volume of merchandise
exports, 2022 Q3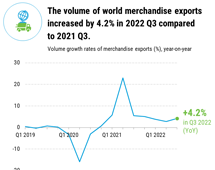
Volume of merchandise
exports, 2022 Q3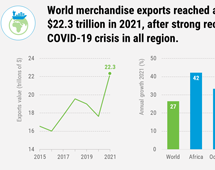
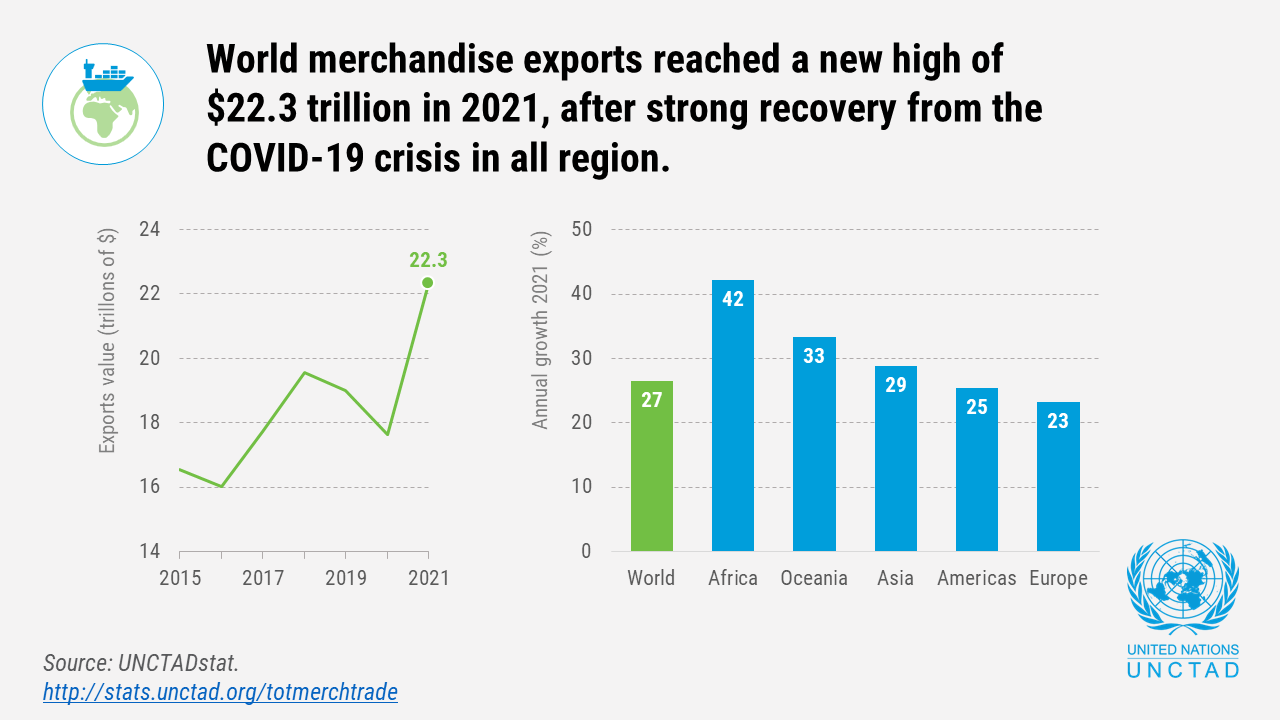
Total merchandise
trade, 2021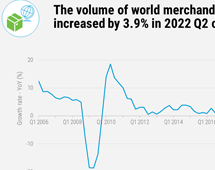
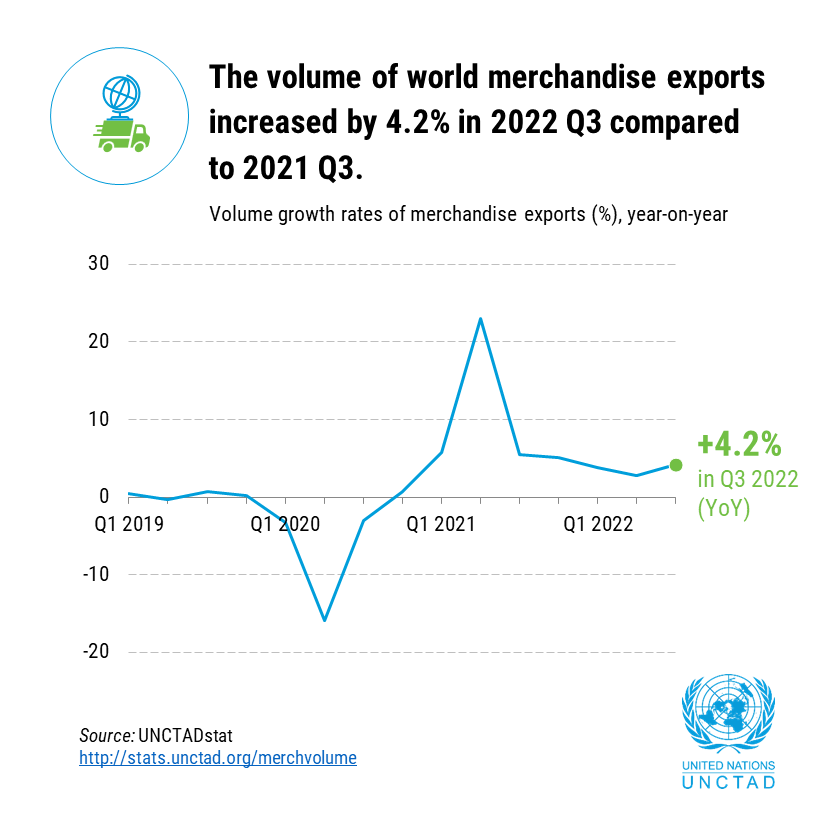
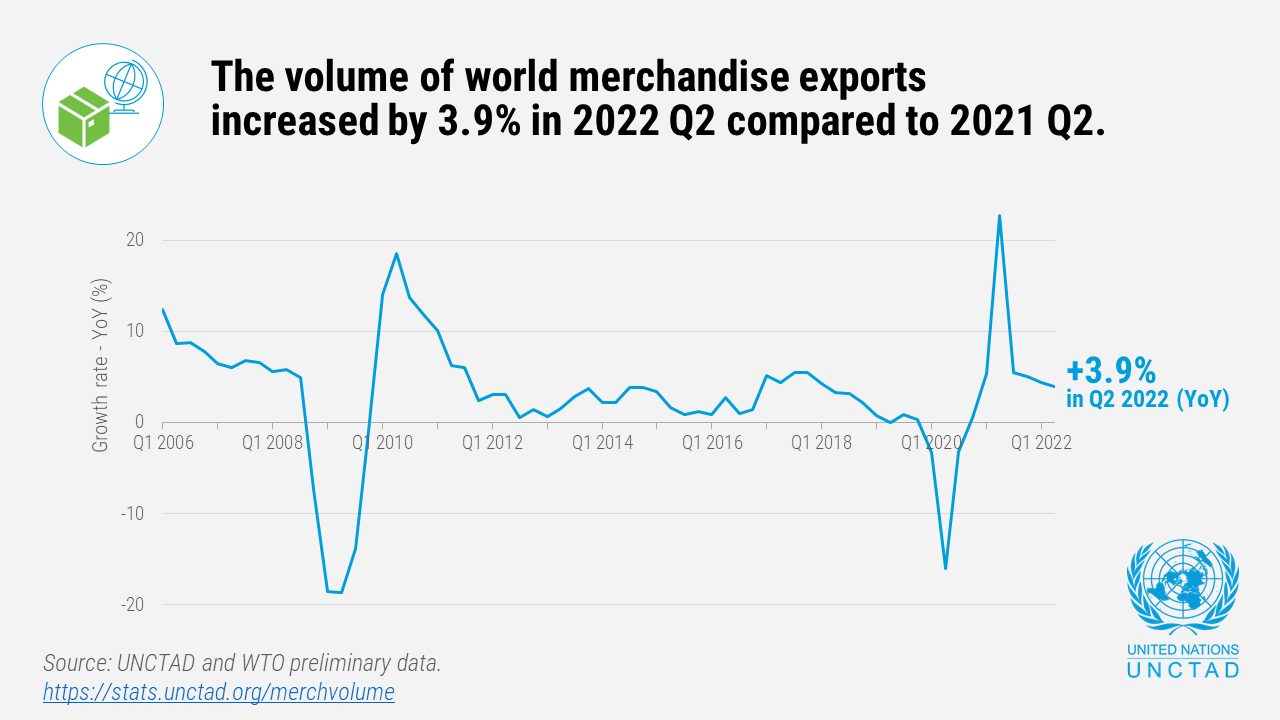
Volume of world merchandise
exports, 2022 Q2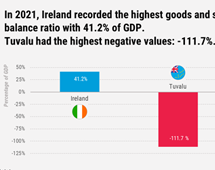
Goods and services
balance, 2021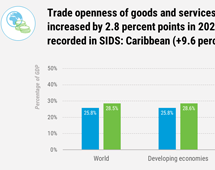
Goods and services
trade openness, 2021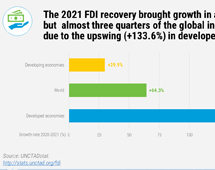
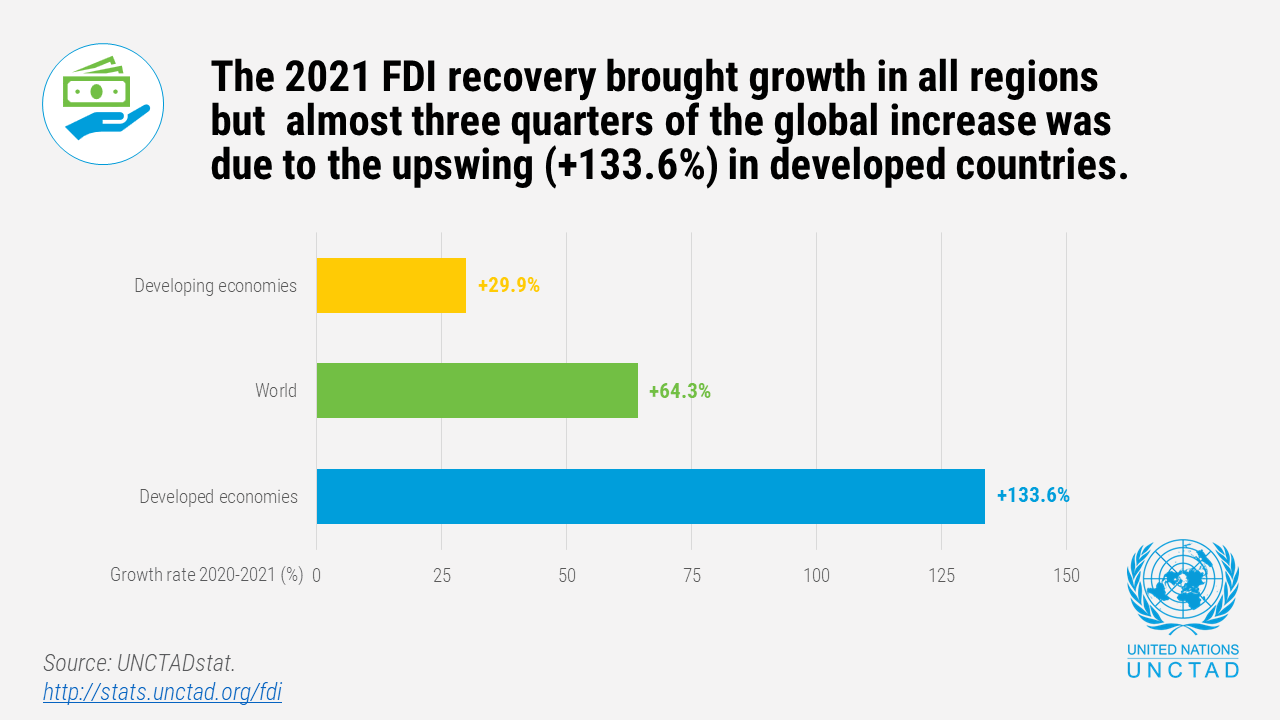
Foreign Direct Investment
growth, 2021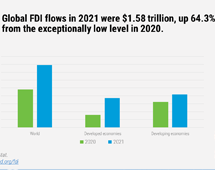
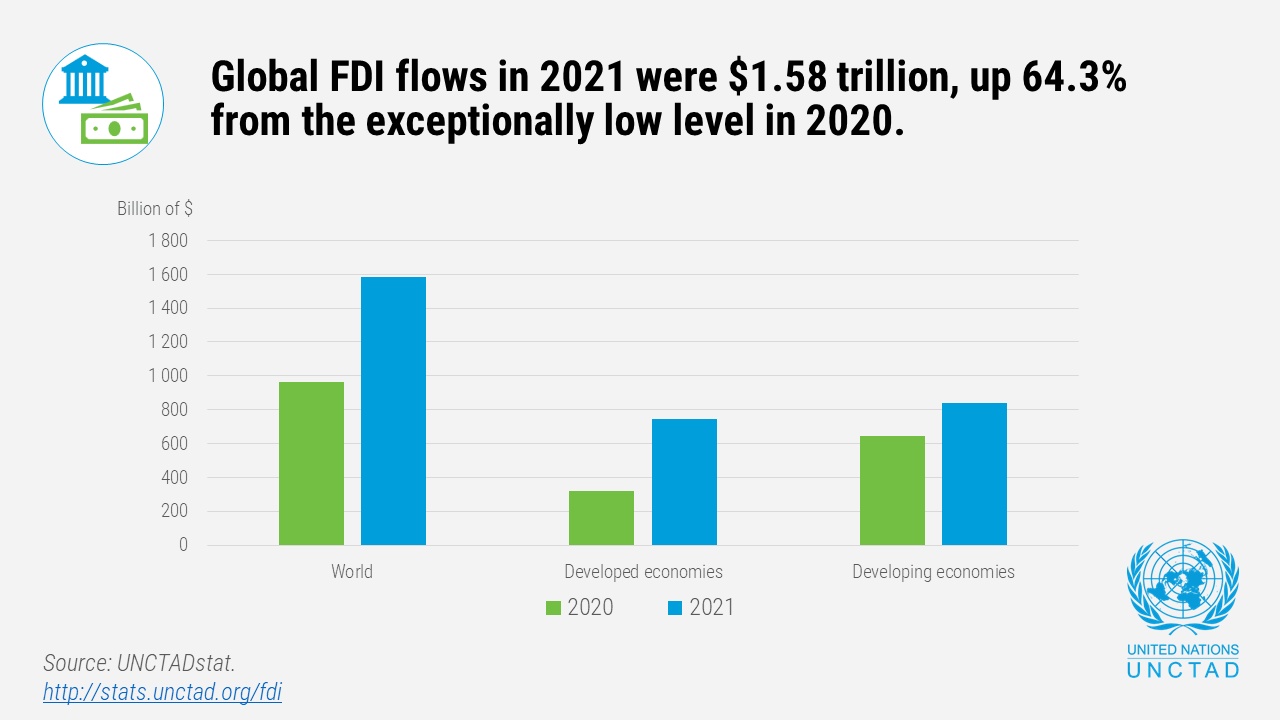
Foreign Direct Investment,
2021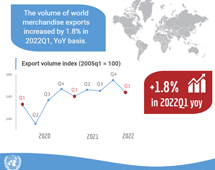
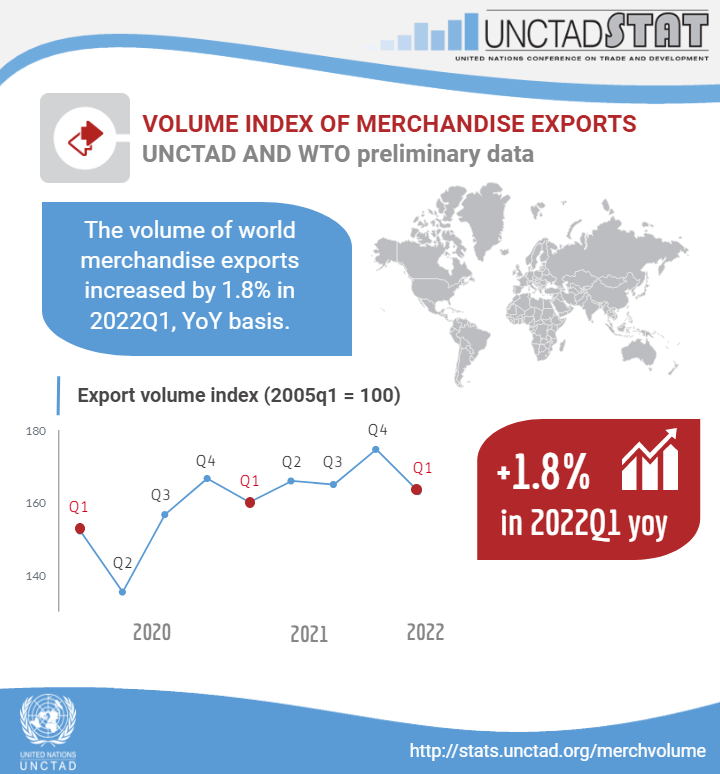
Volume of world merchandise
exports, 2022 Q1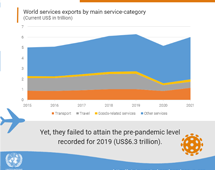
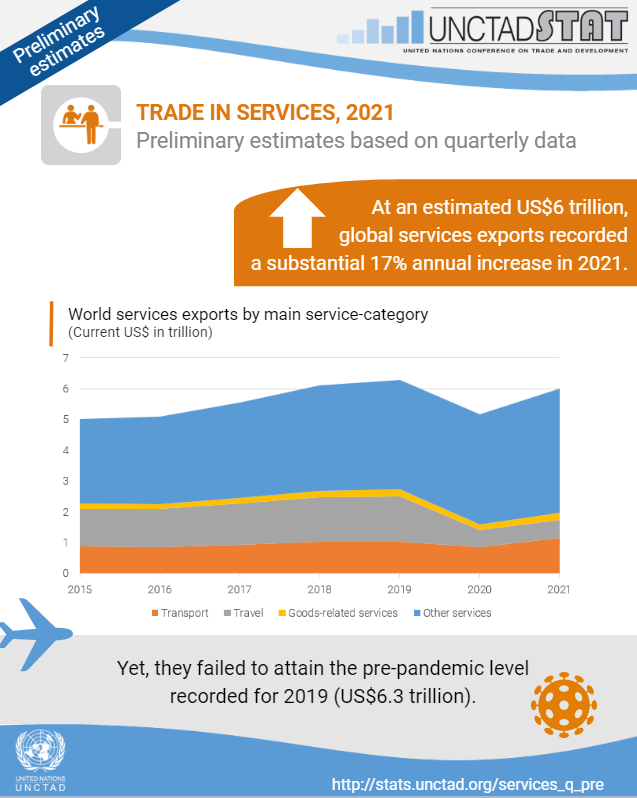
Trade in services,
preliminary, 2021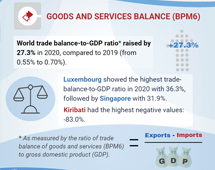
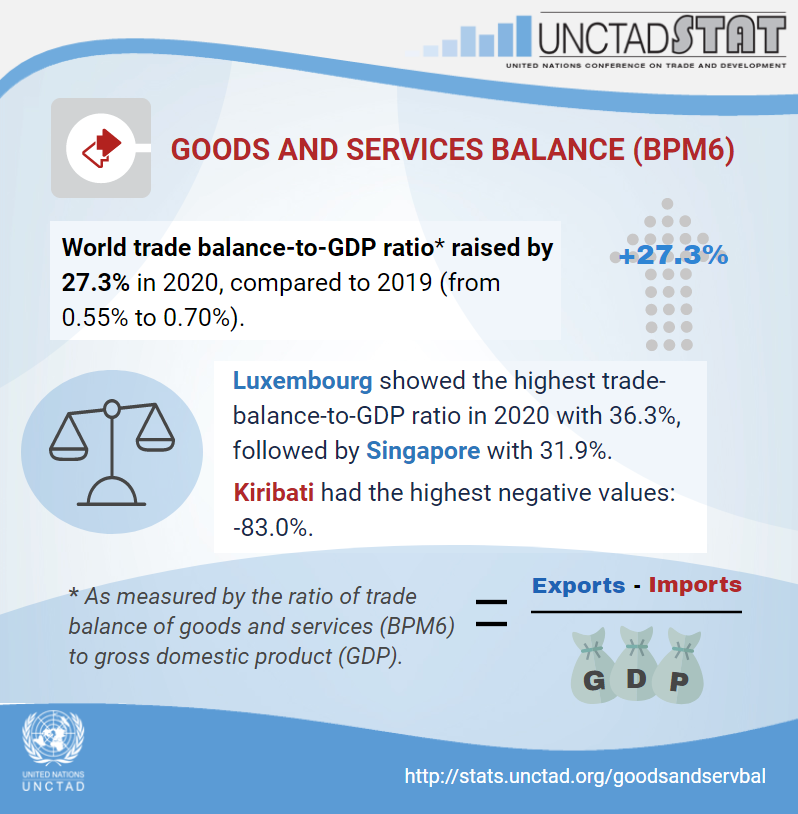
Goods and services
balance, 2020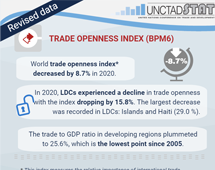
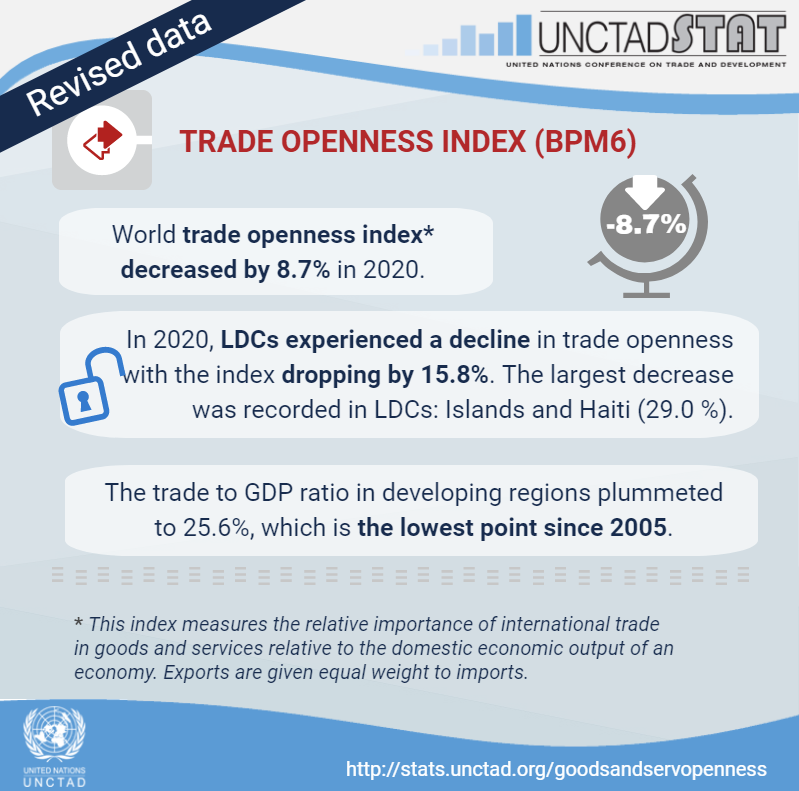
Goods and services
trade openness, 2020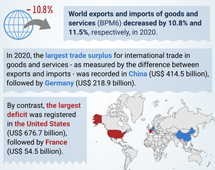
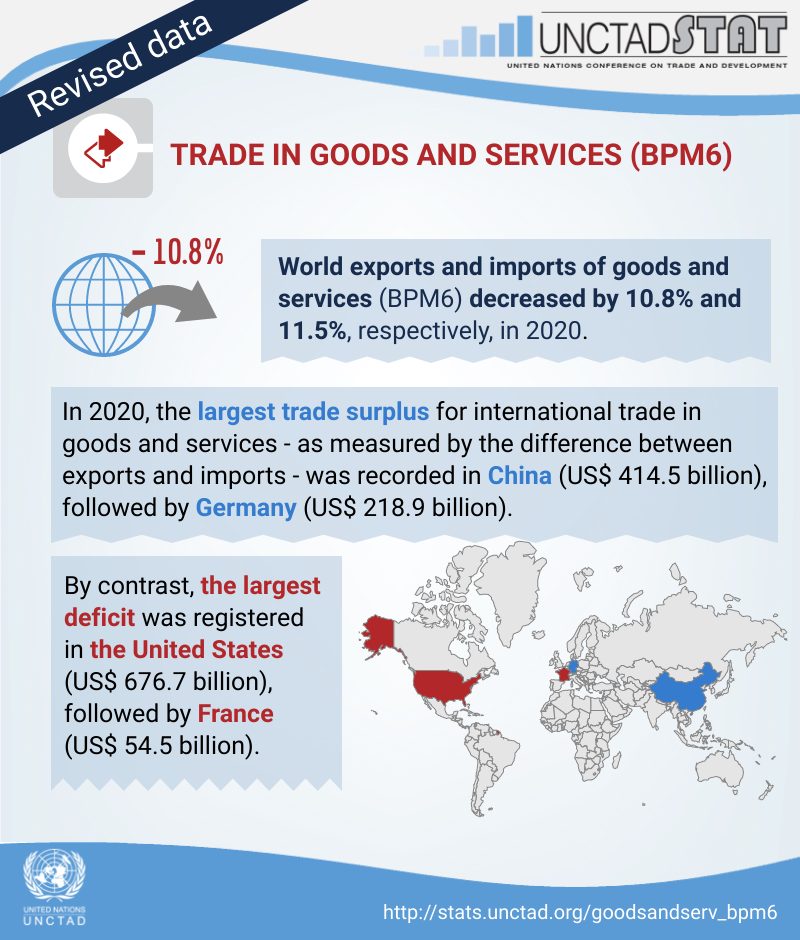
Goods and services,
2020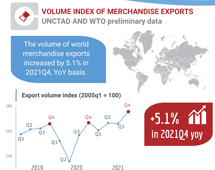
Volume of world merchandise
exports, 2021 Q4