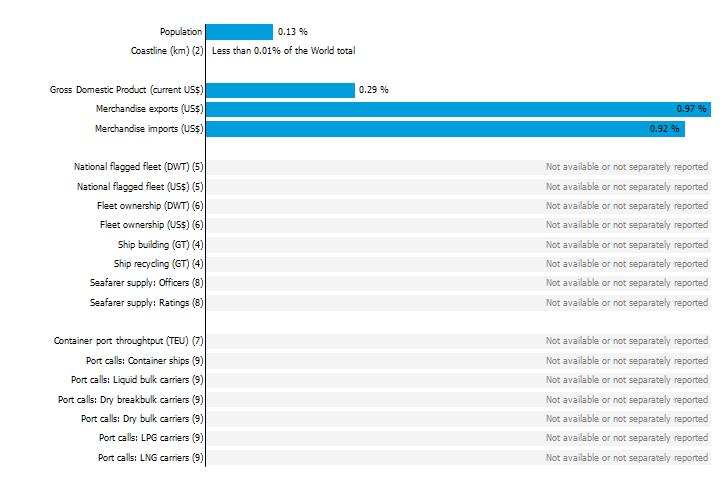
| | | | GENERAL INFORMATION FOR 2024 |
|
|
| | | | | | | | | | | | | | | | | | | | | | | 344 552 Millions current US$ |
| 496 090 Millions current US$ |
| | | | | | | | | Transport services trade³ |
| | | | | | | | | | | | 80 588 Millions current US$ |
|
|
|
|
| | | | | | | MARITIME KEY FIGURES FOR 2024 |
| | | | |
|
| | | | | | | | | | | | | | | | | | | | | | | | | | | | | | | | | | | | | | | | | | | | | | | | | | | | | Container port throughput⁷ |
| | | | | | | | | |
|
|
|
| | |
|
| | | | | | | | | | | | | | INTERNATIONAL MERCHANDISE TRADE |
| | | | |
|
| | | | | | | | | | | | Merchandise exports growth rate in 2024 |
|
|
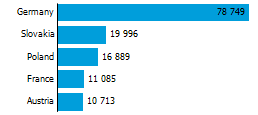
| | | | | | | | | | | | | | | | | | | | | | | | | | | | | | | | | Merchandise trade balance |
| | | | |
| |
|
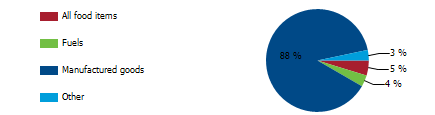
| | | Export structure by product group in 2024 |
|
| | | | | | | | | | (exports, millions of US$) |
| | | | |
|
| | | | | | | INTERNATIONAL TRADE IN TRANSPORT SERVICES |
| | | | |
|
| | | | | | | | | | | | | | Transport services exports growth rate in 2024 |
|
|
| | | | | | | Services exports by main category¹⁰ |
| | |
|
| | | | | | | Total trade in transport services¹⁰ |
| | | | | | | | | | | | | | Transport services exports |
| | | | | | Transport services imports |
| | | | | | Transport services trade balance |
| | | | |
| |
|
| | | |
|
| | | | | | | | | | | | | | | | | | | Fleet growth rate in 2024 |
|
|
| | | | | | | Carrying capacity by type of ship⁵ |
| | |
|
| | | | | | | | |
|
|
|
| | | | | | | | | | | | LINER SHIPPING CONNECTIVITY |
| | | | |
|
| | | | | | Bilateral connectivity index - Top 10 partners in Q1 2006¹¹ |
Can only take values between 0 (minimum) and 1 (maximum) |
|
| Liner shipping connectivity index¹¹ |
|
|
|
| | | | | | | PORT CALLS AND PERFORMANCE |
| | | | |
|
| | | | | | | | Port calls, time spent in ports, vessel age and size in 2023⁹ |
| | | | | | | | | | | | | Median time
in port (days) |
| | | Avg cargo
carrying
capacity (DWT)
per vessel |
| Avg container
carrying
capacity (TEU)
per container ship |
| | Maximum size (GT) of vessels |
| | | | | | | | | | | | | | | | | | | | Liquefied petroleum gas carriers |
| | | | | | | | | Liquefied natural gas carriers |
| | | | | | | | | | | | | | | | | | | | | | | | | | | | | | | | | | | | | | | | | | | | | | | | | | | | |
| |
|
| | | Port liner shipping connectivity index - Top 5 ports in 2024¹¹ |
|
|
|
|
|
| | | | | | | | Source: Detailed data sources are available in the documentation of the corresponding tables in the Data Center (https://unctadstat.unctad.org/datacentre/). A link to these tables is provided in each section of the profile. | | | | | | | | | Notes: | | 1 | Sum of exports and imports. | | 2 | Land area refers to the total area of a country excluding area under inland water bodies. It differs from the country area, that includes area under inland water bodies, but excludes offshore territorial waters.
Coastline length based on data calculated in 2000 from the World Vector Shoreline database at 1:250,000 scale. | | 3 | Sum of exports and imports. Statistics presented correspond to the 6th edition of the IMF Balance of Payments and International Investment Position Manual, 2009 (BPM6, 2009). | | 4 | Propelled seagoing merchant vessels of 100 GT and above. Source: Clarksons Research (https://www.clarksons.com/services/research/). | | 5 | Propelled seagoing merchant vessels of 100 GT and above, on 1 January. Source: Clarksons Research (https://www.clarksons.com/services/research/). | | 6 | Propelled seagoing merchant vessels of 1000 GT and above, on 1 January. Source: Clarksons Research (https://www.clarksons.com/services/research/). | | 7 | UNCTAD Secretariat, derived from various sources including Dynamar B.V. Publications, terminal operators and port authorities. Refers to year 2023. | | 8 | Refers to year 2021. Source: BIMCO-ICS Manpower Report 2015 and BIMCO-ICS Seafarer Workforce Report, 2021 edition. | | 9 | Refers to year 2023. UNCTAD Secretariat, based on data provided by MarineTraffic (http://marinetraffic.com). Ships of 1000 GT and above. | | 10 | Statistics presented correspond to the 6th edition of the IMF Balance of Payments and International Investment Position Manual, 2009 (BPM6, 2009). | | 11 | UNCTAD Secretariat, generated from data provided by MDS Transmodal (https://www.mdst.co.uk). | | e | Estimated. | | k | BIMCO/ICS uses 2018 data from European Maritime Safety Agency. | | p | Estimated. Data refers to 2020. |
| | | | | | | | | Symbols for missing values: | | 0 | Zero means that the amount is nil or negligible | | .. | No value reported or collected | | _ | Not applicable | | ... | Not available, including no quotation | | # | Non-relevant calculation | | - | Not publishable | | *** | Negative accumulation of flows; Value included in regional and global totals |
| | | | | Abbreviations & acronyms: |
| | | | | | | | | | | | | | | | | | | | | | | | Twenty foot equivalent unit |
| | | | | Disclaimer: The designations employed and the presentation of the material on UNCTADstat do not imply the expression of any opinion whatsoever on the part of the secretariat of the United Nations concerning the legal status of any country, territory, city or area, or of its authorities, or concerning the delimitation of its frontiers or boundaries.
Where the designations "economy" or "country or area" appear in texts or tables, they cover regions, countries, territories, cities or areas.
The designations "developing", "transition" and "developed" are intended for statistical convenience and do not necessarily express a judgement about the stage reached by a particular economy in the development process.
UNCTAD strives for the highest level of accuracy and is committed to promptly correcting any errors on its part. It does not guarantee or make any express or implied representations regarding the accuracy, reliability, correctness, fitness for use for a particular purpose, or otherwise, whatsoever, of any of the tables in UNCTADstat. |
| | | | | Generation date: 02 December 2025 |
|
|
|
|
 PDF
PDF Share
Share